Company Overview
Manutan (MAN.PA) was founded in 1966 by Andre & Jean-Pierre Guichard as the first French company specializing in catalogue selling of industrial equipment. The company is now the leading player in the European B2B mail order (or distance selling) market for office/industrial equipment and supplies – basically, the classic distributor model seen in office supplies, IT equipment, and many other industries.
The company operates in more than 20 countries, offering more than 200,000 products to 600,000 clients through both catalog (70%) and internet (30%) channels. The average order value is just €470.
Management Team
Record of Solid Long-Term Performance
The Guichard family continues to own 70% of shares and 77% of voting rights, and has expressed a desire that the company stays independent (so it’s unlikely that a competitor buyout will unlock value here). With that dynamic in mind, it’s important to look at the family’s track record.
Reading through the annual reports, phrases such as “steady growth rate” and “controlled expansion” and “long-term view” are mentioned numerous times. Here are the company’s results over longer time periods:
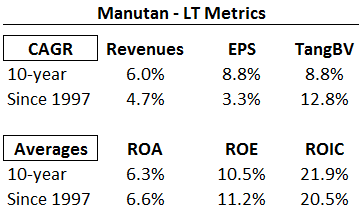
Over every time frame, MAN.PA has shown an ability to grow at rates higher than inflation through a combination of organic growth, new country expansion, and select acquisitions. Most importantly, this growth has been achieved while maintaining double-digit ROEs despite a large net cash position.
A high ROE without using leverage translates into average ROICs above 20%.
So why is this a good business?
– Low Supplier Power – Manutan sources products from almost 1,300 suppliers, with no single vendor accounting for more than 3% of purchases. Distributors like Manutan help manufacturers reach a broader customer base, as many do not have the right personnel or infrastructure to do it alone
– Low Buyer Power – Manutan serves more than 600,000 customers, with none more than 2% of turnover. Large accounts can negotiate product discounts due to volume, but these price concessions are mitigated by smaller customers purchasing at full price via online sales channels.
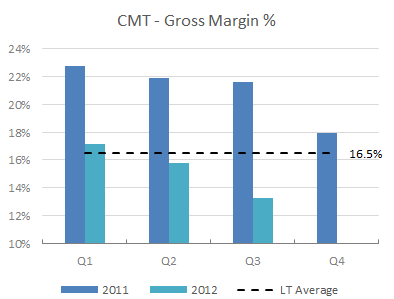
– Anti-Cyclical Cash Flows / Margins – Manutan benefits from anti-cyclical gross margins, as shown in the chart below from a competitor presentation:
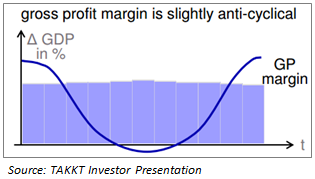
This through-cycle margin profile is likely from suppliers trying to push inventory through the channel when sales stall (allowing MAN.PA to get better purchase prices), while at the same time allowing Manutan to hand out fewer volume discounts on the customer side.
As evidence, the company’s GM% increased +350bps from 2000-2002 and +30bps from 2007-2009.
In addition, these kind of distributors benefit from positive working capital cycles during recessionary periods, as inventory is worked down and receivables are collected. Manutan generated +€22.4m and +€24.5m in cash flow from working capital movements during the last two recessions.
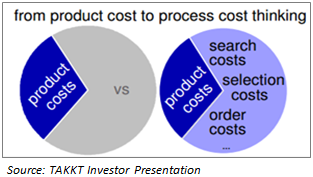
– Product Breadth = Competitive Advantage – I spoke to a buyer in the procurement department of a large multi-national company. A big component of their procurement costs are the logistics of setting up purchase contracts and processing purchase orders across multiple vendors.
Working through a distributor not only provides better pricing, but allows these companies to place one purchase order for hundreds of items versus placing hundreds of POs with multiple vendors, cutting down on transaction costs.
So scale becomes a big advantage (MAN.PA is the European market leader), as customers look to rationalize all costs in the procurement process, not just the product price. This is illustrated in the graphic below:
Performance Stems from Long-Term Thinking
Another quote stuck out in the annual report (compare it to W.E.B.’s famous line):
“During the financial crisis, we made the strategic decision not to cut our marketing and commercial investments.” – Manutan AR
“A simple rule dictates my buying: Be fearful when others are greedy, and be greedy when others are fearful.” – Warren Buffett
True to their word, management was not shy about investing in the business during the recession, making large commitments in several key areas:
1) Continued investments in its European Centre, a €70m development project which will serve as a new headquarters, state-of-the-art logistics center/warehouse, and employee training & development center. The facility will be fully operational this year.
2) Company-wide IT overhaul to centralize the group’s warehouse management, content management, and e-business platforms within one system for all geographic areas. This sounds like a long overdue project, and MAN.PA has invested almost €40m in this project over the past five years.
3) Opportunistically acquiring 2 companies plus land/storage space during 2008 & 2009 (spending €35m), the first major acquisitions since 2000. Both added specialist niches, allowing the company to offer a wider array of projects and further expanding the value proposition (“one-stop shopping”).
These investments have consumed significant free cash flow, depressed margins and impacted ROIC over the last several years. Very few management teams are willing to make these decisions in the face of the inevitable pressure on their stock price – this long-term thinking is a major positive. These investments also setup the company for the core part of the thesis: reversion to the mean.
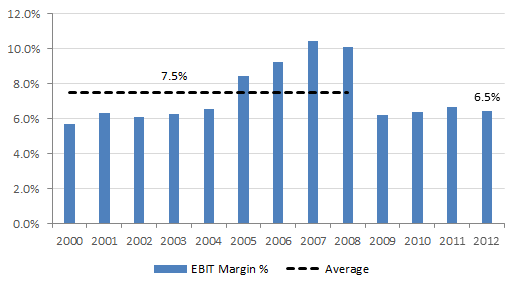
Margins – Reversion to the Mean
Manutan saw a sharp decrease in margins in 2009, with EBIT margins falling from north of 10% to just above 6%:
Why the decrease?
In March 2009, MAN.PA purchased Camif Collectivites, a distributor to the public (i.e. government) and education sector. The largest acquisition (on a revenue basis) in Manutan’s history, the purchase price was just $3.1m, as MAN.PA bought Camif after the bankruptcy of its parent company (not to mention during a terrible economic climate).
Check out the purchase multiples on the deal: 0.02x revenue, 1.1x operating profit and 0.55x BV.
While the deal was done at a very attractive price, margins in Camif are structurally lower, and the continued problems in Europe have caused even greater pressure. Camif was barely profitable in 2009 & 2010.
Management has taken steps to improve margins by:
– Adding several hundred higher margin products from the core business lines to Camif’s offerings
– Rationalizing the purchasing/sourcing process at Camif to lower cost of goods sold
– Expanding its scale within the public markets through additional acquisitions (see Valuation section below)
These steps have increased operating margins in the South region (where Camif is consolidated) by >100bps since 2009, with further improvements likely.
Management is targeting a 5% operating margin for Camif, almost double the current level. On $125m in run-rate sales, an improvement to 5% margins for Camif would boost EBIT by approx. €2.3m, raising overall profit margins by 50bps.
Several other geographic regions are currently reporting margins below long-term trends, with mean reversion potential there as well.
With continued improvements, a normalized operating profit margin around 7% is achievable (+70-100bps), which is only slightly below the long-term average.
Manutan is a good candidate for ‘reversion to the mean’ since the margin compression has occurred at the operating level – management has been able to maintain and even increase gross margins (both at Camif and in the core business), a good signal that the business has maintained its pricing power and competitive position.
Therefore, much of the margin reversion potential will come from rationalizing SG&A, technology, & marketing expenses – all of which are largely under management control.
Valuation
Comp. Valuation – Reversion to the Mean
TAKKT is Manutan’s closest competitor in the distributor space, and Manutan has historically traded at a discount to its larger competitor. Over the last five years, multiples have compressed sharply for both stocks.
However, the valuation gap between the two stocks has reached all-time highs:
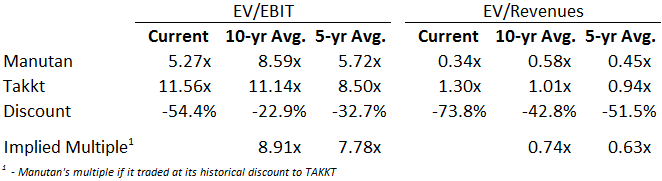
The current EV/Revenues multiple is the highest recorded, while the gap in EV/EBIT multiples has only been this wide on 0.9% of days in the past ten years (23 days out of 2,575).
TAKKT has grown faster out of the recession, due primarily to its wider geographic focus (40% of its business is in the U.S.). In addition, the gap in profitability has also increased due to Manutan’s (temporary) margin challenges. TAKKT arguably deserves to trade at a premium, but the current one seems far too wide.
However, in the long-term, this valuation disparity should close, as operating performance normalizes at MAN.PA. Here’s how Manutan would stack up if the market prices the stock at its historical discount to TAKKT (somewhere between the midpoint of the 5 and 10 year average discount):
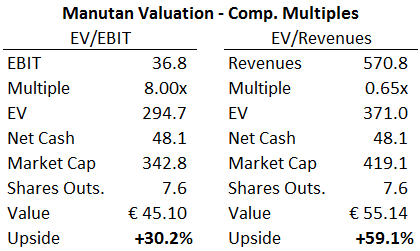
The EV/EBIT implied value is lower given the current depressed state of operating margins. At a 7.25% normalized margin, Manutan would have EBIT of €41.3m on TTM sales, or a €50 stock price at the implied multiple.
Valuation – 2015 Forecast
However, it will likely take 2-3 years before Manutan’s margins normalize, as the 2013 outlook for Europe remains murky and the Camif turnaround is still ongoing.
In addition, Manutan acquired Casal Sport in Oct. 2012, a leading distributor of sporting goods to educational institutions. Casal offers complimentary products to Camif, providing synergy opportunities and increasing scale in the public market segment.
With revenues of €48m, the acquisition will push FY’13 revenues near €600m, but contribute initially at 5% margins (lower than the group average).
Here’s how the business could look by FY’15 under several scenarios:
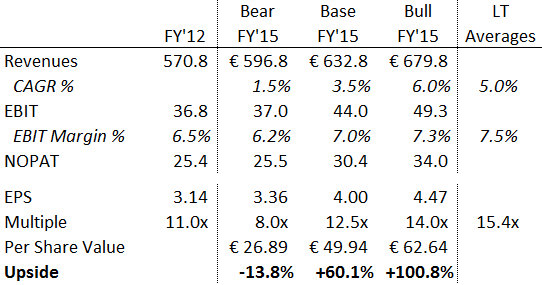
The bear case provides only marginal downside (-14%), as the market seems to be pricing in in flat sales, continued margin compression, and multiple contraction to near ’09 lows – essentially a perfect storm of bearishness.
A more reasonable base case is that margins improve 50bps to 7% (still below historical averages) and the multiple improves slightly to 12.5x. This estimate provides €4/share in earnings power and a €50 stock price.
With 60% upside in a conservative base case vs. just 14% downside, MAN.PA offers an attractive risk vs. reward.
Valuation – Forward Return
One last way of looking at the stock is on the basis of its forward FCF yield, after adjusting for the company’s normalized earnings power:
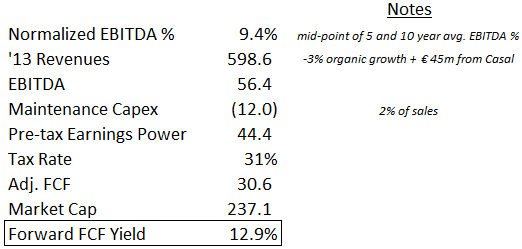
With normalized EBITDA margins of 9.4% and maintenance capex at 2% of sales, Manutan would produce after-tax FCF of €30m, offering 13% forward yield (or 16% FCF yield to EV).
Why Is the Stock Cheap?
1) Margins pressure / poor short-term returns – TTM ROIC is 13.1% compared to the LT average around 20%, as the fall in margins has been compounded by a dramatic increase in invested capital – the HQ/distribution project has added €70m in net PP&E to the balance sheet over the last 4 years despite not being operational (and therefore not contributing to returns).
Going forward, margins are expected to improve and IC should grow at a much slower rate (or even shrink), driving returns closer to the long-run average.
2) European troubles – MAN.PA’s financial results and stock price are highly correlated to the economy, especially the European PMI index:
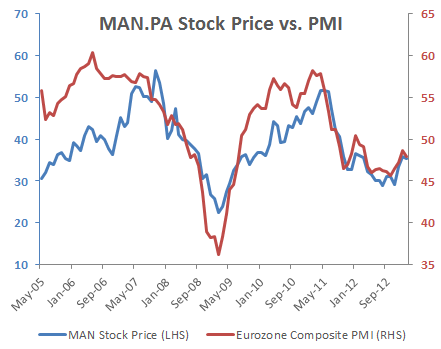
Unlike TAKKT, Manutan has continued to focus exclusively on the EU, choosing to concentrate its leadership position despite the poor economic climate. While a return above 50 for the PMI (signaling expansion) is probably unlikely in 2013, the eventual recovery will provide a boost to results.
3) Family-control / illiquidity – The stock only trades 2000 shares a day (~$65k in ADV), too small for most institutional investors. In addition, many investors view family-control as a negative, a viewpoint I do not share (assuming the family has a long history of prudent capital allocation, see my investments in TES.PA, COM.PA, IBAL and others).
Conclusion
Manutan is a rather boring stock with a solid business model and long-term track record. Based on a multi-decade history, the company is capable of growing at 3-6% while reinvesting capital at returns approaching 20%.
At current prices, investors are paying <10x depressed earnings for an above-average, growing business, headed by a management team which has demonstrated an affinity for planning (and investing) for the future even at the expense of short-term profits.
With excessively bearish forecasts already baked into the stock and several areas of potential reversion to long-run averages (margins, ROIC, comp. valuations, etc.), now is a good time (in fact, one of the best times in the stock’s history) to partner with the Guichard family.
Disclosure
Long MAN.PA & other stocks mentioned