Company Background
Core Molding Technologies (AMEX:CMT) is a manufacturing business that focuses on reinforced plastics – a type of plastic that is combined with a reinforcing fiber (like glass or carbon) and then molded into shape.
CMT makes sheet molding compound (SMC), a major input into compression molded products, and therefore controls the production process through its five facilities in the U.S. and Mexico.
These facilities encompass over 1M square feet of manufacturing space, making the company one of the four largest compounders and molders of reinforced plastics.
Reinforced plastics are used in the transportation, construction, marine, and industrial markets, but the primary use is for trucking – sales to the trucking industry made up 91% of CMT’s sales in 2011.
CMT was formed in 1996 for the express purpose of purchasing the Columbus Plastics unit from Navistar (a major truck company), a relationship which continues to this day – Navistar remains a major shareholder and accounts for 44% of sales.
Investment Thesis
#1) Highest recorded age of trucking fleet, combined with new orders still at or below replacement rate, point towards continued revenue growth for CMT
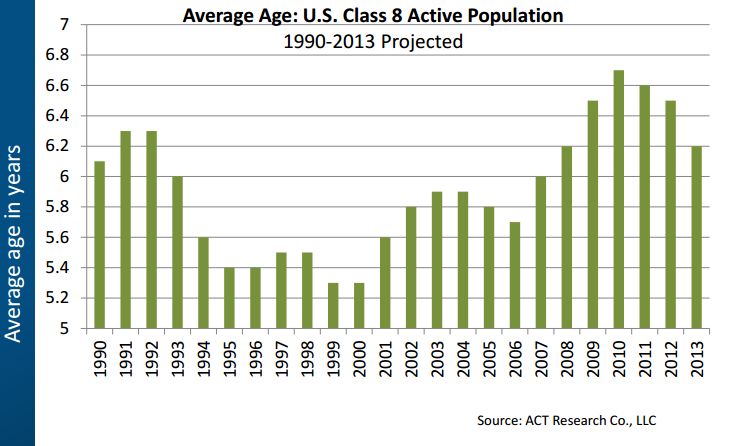
In 2010, the average age of the U.S. trucking fleet was 6.7 years, the highest in history, and industry experts are projecting a gradual decline in fleet age due to an increase in new truck orders:
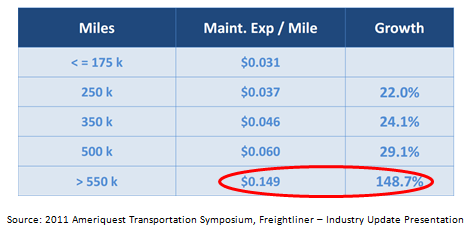
This growth is driven by the fact that such an old fleet cannot be maintained because of exponentially increasing maintenance costs as trucks get older:
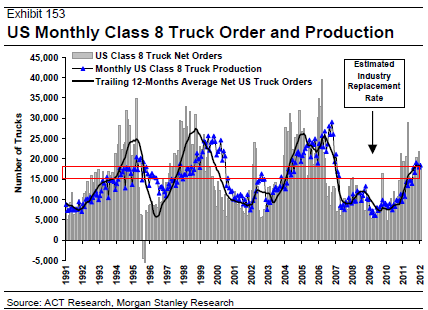
This dynamic is reflected by the run-up in truck orders since the 2009 lows, but the industry is barely at replacement rate and far below previous peaks in the trucking cycle:
March and April truck order numbers came in below expectations, but according the ACT Research, a leading market research firm, expectations remain bullish for 2012 (with truck orders forecasted at 299,000 annual units, or ~25k per month), along with expected strong demand into 2013 and 2014:
“our expectations for the cycle peak in 2013 are shallower with stronger demand now stretching through 2014.”
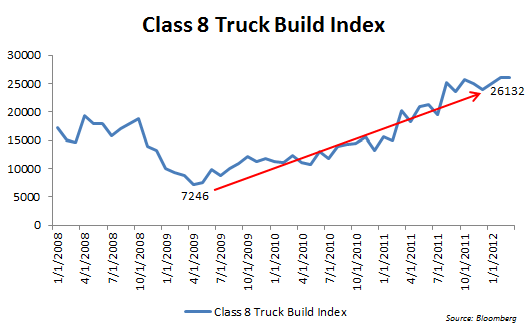
This is backed by the strong upward trend in truck builds:
This bullish industry outlook should provide ample runway for revenue growth at CMT for at least the next two years.
#2) Investments in manufacturing and capacity expansion have raised capex significantly above maintenance levels, whereas normalizing these numbers showcases CMT’s strong free cash flow generation
Average FCFE over the past ten years was $3.8mm, a FCF yield of 6.6% based on a market cap of $57.3mm.
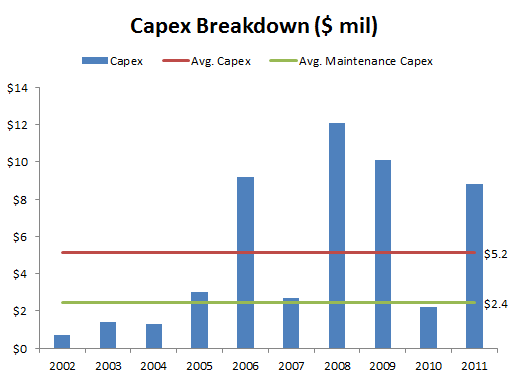
However, this average number is skewed by several major expansion projects which have doubled average capex over the past four years:
– 2009: CMT opened a 476k sq. ft. manufacturing plant in Matamoros, Mexico, transitioning from a formerly leased space. A $20.2mm project, the new facility increased floor space in the region by 43%.
– 2010: the company announced a major expansion of the Mexico facility in order to handle increased order flow and new product launches. The project is expected to cost $14.5mm, with $6.3mm spent so far in 2011.
– 2011: CMT leased a new 62k sq. ft. facility in Warsaw, Kentucky for its Core Specialty Composites division, which was created to produce parts for customers outside of the trucking industry. The company spent $1.2mm on leasehold improvements for this new facility, and management expects that the Kentucky facility will be fully operational by mid-2012.
Here’s the a breakdown in capital expenditures in chart form:
Of the $51.5mm in total capex spend over the last ten years, $27.7mm was spent specifically on growth/expansion projects.
After subtracting out these growth investments, average maintenance capex is only $2.4mm (which also happens to more closely resemble average D&A of $3mm).
Using average maintenance capex, a normalized FCF number is around $6.5mm, for an adjusted FCF yield of 11.3%.
#3) Capacity gains plus efficiency improvements have transitioned CMT from below-average to above-average business since the previous upswing in trucking cycle
By a variety of metrics, CMT is operating more efficiently now than ever before in its history, especially at this stage of the trucking cycle.
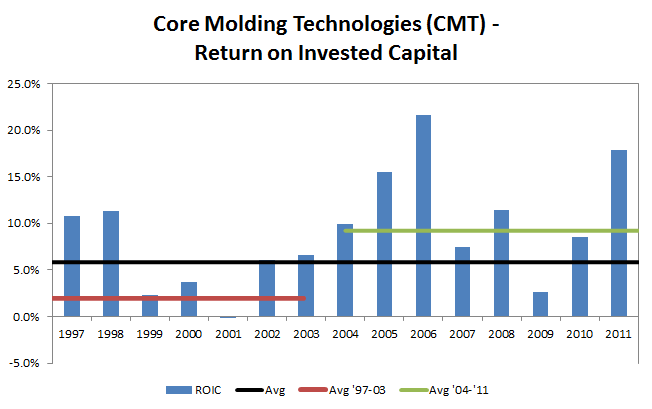
Since 2003, ROE has averaged 17.48%, compared to an average of 8.99% in the previous seven years. Looking at similar time periods, average ROIC has increased from 5.8% from ’97-’03 to 11.8% for ’04-’11, as showcased in the graph below:
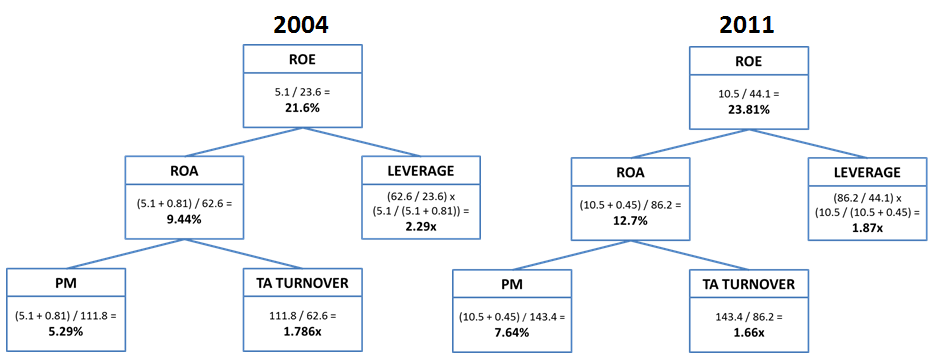
Another illustration would be a DuPont breakdown – 2011 results are similar to 2004, another good year for CMT and at a similar point in the trucking cycle:
The ROE decomposition clearly shows an improving ROA, driven largely by higher profit margins. It also shows the decrease in leverage – while total debt is nearly identical in 2004 and 2011, CMT is paying a much lower interest rate.
Asset turnover is down slightly, but that is to be expected. In 2001-2004, the company had no major expansion projects and capex was low.
However, CMT has invested heavily in new assets over the past several years – as those assets come online and become fully operational, turnover should increase and operational leverage will kick in, boosting returns even further.
#4) Investments in high-end machinery (i.e. plastic presses > 2000 tons) provide a competitve advantage, and should help CMT maintain higher average margins through the next cycle
According to the company’s SEC filings, CMT
“possesses a significant portion of the large platen, high tonnage molding capacity in the industry.”
These large presses weigh over 2,000 tons, and are used for the largest molding projects. As of December 31, 2011, the company owned 18 large presses, with 2 more planned for purchase in 2012.
At this size range, even a 10+ year old used press sells for $500k or more, so a competitor would be looking at investments in the tens of millions of dollars in order to compete with CMT for the larger press jobs.
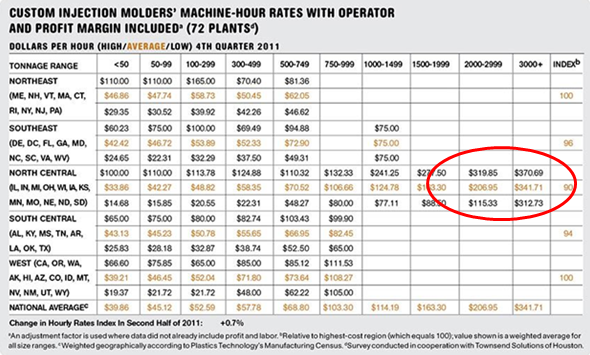
The the chart below shows the increase in machine-hour rates for a range of plastic molding machine sizes:
Presses greater than 2,000 tons command a 4x-7x price premium over smaller machines.
This shift towards larger, higher value machines could help explain the uptick in CMT’s margins – average gross margins are running roughly 200 basis points above the previous cycle, and the 2011 GM of 20.8% was the highest since 1997.
An increasing gross margin does indicate some pricing power for CMT, and investments in these higher-end machines point towards a structural – not temporary – shift to higher margin business.
Management
Management is well-paid, but has a solid long-term track record – Over the past 10 years, CMT has grown book value per share at 15.5% annually.
The C-suite executives have demonstrated tremendous loyalty to the company, as all joined shortly after inception and have been with the company for 13-15 years. Insiders hold 11.6% of shares outstanding.
Two other well-respected value-oriented investment firms, GAMCO and Rutabaga Capital, own 14.1% and 9.5% of shares respectively. Navistar retains a 9.2% ownership stake, even after CMT bought back and retired 3.6mm shares from Navistar in 2007.
In addition to some stock options and restricted units, the company also leverages a profit sharing plan as part of its compensation. The plan kicks in after achieving an 8% hurdle rate on a ratio of EBT / Adjusted Average Total Assets, and is capped at 20% of EBT – the ratio produces result similar to ROIC.
While the 8% hurdle rate might be a bit low, the plan is much more reasonable than many other compensation schemes out there.
Risks
While there are risks with the company executing on its expansion projects, or gauging the exact stage of the trucking cycle, the most critical risk is customer concentration.
PACCAR and Navistar, two of the largest class 8 trucking companies, make up 80% of CMT’s sales. Put simply, losing either customer would be a major setback.
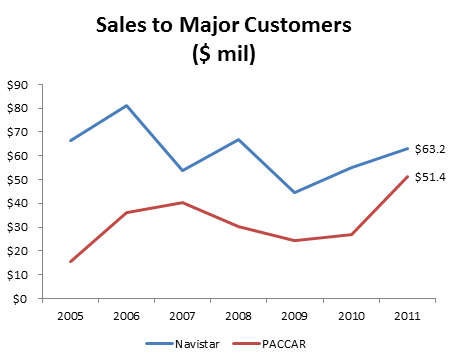
Here is a breakdown of CMT’s sales to its two largest customers:
PACCAR is becoming an increasingly important part of CMT’s business, and now makes up 36% of sales versus 44% for Navistar.
Despite the customer concentration, CMT has a long relationship with both of its major customers:
Navistar
CMT has been associated with Navistar since 1996, as the company’s founding purpose was to acquire the Plastics division from Navistar. CMT also signed a comprehensive supply agreement with Navistar in June 2008, which was renewed in Jan. 2010.
Under the agreement, CMT
“continues to be the primary supplier of Navistar’s original equipment and service requirements for fiberglass reinforced parts, as long as the Company remains competitive in cost, quality and delivery.”
The agreement is up for renewal in October 2013, but the non-renewal risk is mitigated by several factors:
- Navistar remains a significant investor and shareholder of the company, holding 9.2% of shares outstanding. The current Chairman of the board (and former CEO of CMT), was a VP of Navistar from 1992-1998 and presumably retains some key relationships there. In addition, another board member, Thomas Cellitti, is Navistar’s SVP of Reliability & Quality, and has been on CMT’s board since 2000.
- As part of the amended supply agreement, CMT moved production from its Ohio facilities to its Mexico plant in order to more effectively supply Navistar’s Mexican operations. This was a costly move, and CMT has invested millions more in expanding the Mexican facility.
It’s unlikely that management would take such drastic steps unless they were reasonable assured that a supply deal would be re-signed.
PACCAR
While CMT has no formal relationship, PACCAR has been a named customer going back to at least 2005. In addition, recent sales results show a positive growth trend lending credence to the assumption that CMT is becoming a more important supplier.
In 2011, sales to PACCAR were up 97%, achieving a record of $51.4mm. This was $11.1mm, or 28%, greater than the previous high set in 2007.
Health of Navistar / PACCAR
Of the two, PACCAR seems to be the better-run company, but both enjoy a healthy percentage of the overall truck market in North America.
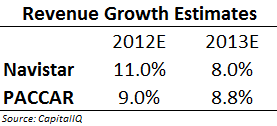
Both customers are expected to grow at a healthy clip over the next 2 years:
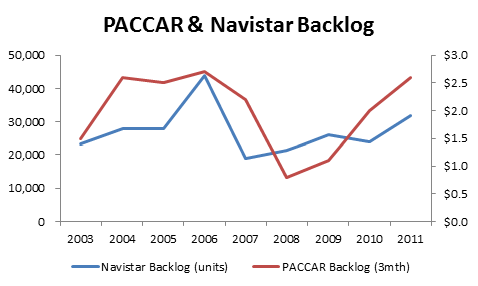
These revenue growth expectations are backed by increasing backlog as of the end of 2011.
Navistar’s backlog of 32,000 units was the highest since 2006 while PACCAR’s 3-month backlog of $2.6B was just shy of the record of $2.7B in 2006.
Both companies were bullish in their latest disclosures and conference calls:
Navistar Analyst Day – Feb 2012
“We’re saying right now that our 2012 industry forecast is, give or take, a 15% increase over 2011. But we believe that 2013 and ’14 will again have increased volumes from an industry standpoint”
“We think that there’s an opportunity to grow our market share by about 10%. So we’re — we’ve — we finished the year around 21%”
PACCAR Q4 Conference Call – April 2012
“U.S. and Canadian industry retail sales are estimated to improve this year to a range of 210,000 to 240,000 units, up from 197,000 last year. This is being driven by ongoing replacement of the aging truck fleet and some economic growth”
“I think people are just — they’re buying what they need. They certainly recognize the very tangible benefits of having a new truck versus a truck that’s 5, 6, 7, 8 years old. That can be measured in thousands of dollars per year.”
Other Customers
While CMT is heavily dependent on Navistar and PACCAR, sales to other customers (primarily other major truck manufactures) increased 57% to $18.3mm in 2011.
This is an encouraging sign, and there appears to be further runway to diversify based on results from prior years (for example, sales outside of the big 2 were $45mm in 2006).
In addition, the Kentucky operation was created in order to further diversify outside of the core business segments, lessening the concentration risk.
Valuation
CMT does not have a useful public comp in North America, so instead a comparison can be done based on the company’s historical averages:
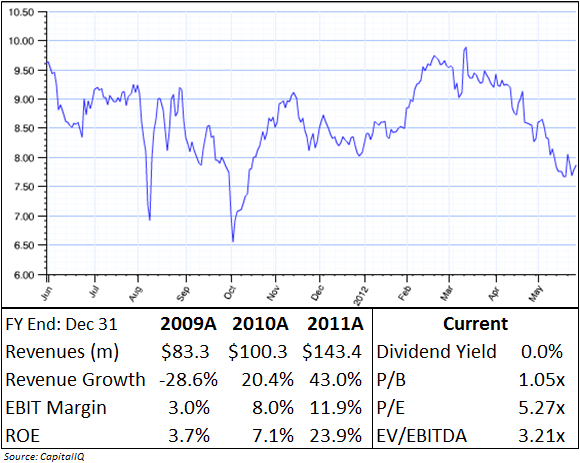
A normal P/B multiple of 1.4x would yield a share price of $10.46 (40% upside), while an average EV/EBITDA multiple of 6x would yield a share price of $16.12 (105% upside).
At TTM 5.3x P/E, the current valuations is overly pessimistic, and represents a state more similar to an industry on a cyclical downswing – a stage of the trucking cycle that is unlikely given:
(1) the size and increasing nature of order backlogs (both at CMT and its major customer)
(2) the extreme age of the current trucking fleet
(3) double digit growth forecasted by industry expert and confirmed by major truck manufacturers
(4) an order rate still below the truck replacement rate and well below past peaks in cycle
Catalysts
- Record year-end backlog leads to another huge revenue year – Backlog of $15.2mm at year-end 2011 is a record number, and 29% higher than previous record of $11.8mm in 2005. By comparison, the 2005 backlog translated into 2006 revenue of $162mm, a mark which should be surpassed in 2012. Q1 2012 sales were up 53%, confirming this trend.
- Additional manufacturing capacity comes online in 2012, boosting revenue growth even further – The Kentucky plant alone is expected to contribute $5-8mm in incremental annual revenue once it becomes operational in 2012
- Additional product sales cover larger investment in fixed costs and capacity, and operational leverage boosts income – Net PP&E is over 50% of total assets, so the business is inherently leveraged, and volume increases will translate to an even greater jump in EPS
- Multiple expansion boosts stock price as strong results confirm that trucking market cyclical upswing continues
Conclusion
Purchasing CMT is an opportunity to pick up a well-run company at a 10%+ normalized FCF yield and a discount to long-term valuation multiples at an attractive point in the trucking cycle.
In the Q1 2012 earnings report, revenue growth materialized as expected, but margins were hurt by “production inefficiencies and startup costs.”
Based on the long-term track record, management has proven the ability to deal with these operational hiccups and the recent sell-off presents an attractive entry point – the company should report strong bottom-line results for FY2012 as operational leverage improves.
Disclosure
Long CMT

