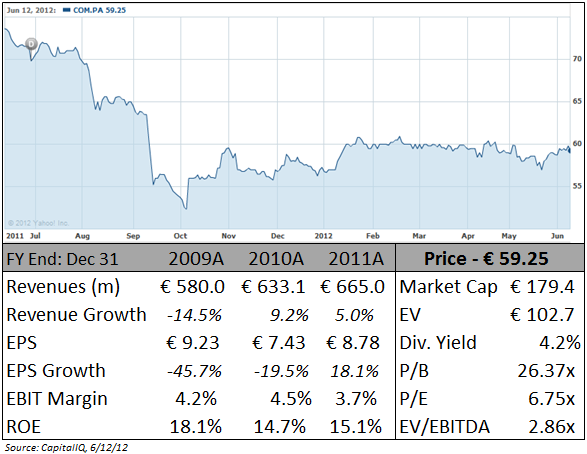
CNIM - Financial Overview

Company Overview

Constructions Industrielles De La Mediterranee, or the CNIM Group (EPA:COM), is a French industrial conglomerate which traces its roots back to 1856 – see the full history here.

After a number of acquisitions and division realignments over the years, CNIM has rounded into its current form providing turnkey high-tech industrial solutions in three main areas:

Environment – includes the production and operation of waste-to-energy (WTE) plants, including component parts such as flue gas treatments

Innovation & Systems – includes government contract work (such as missile launch, sea landing, and bridging systems), nuclear parts manufacturing, and industrial research services

Energy – includes solar projects, rehabilitation of water treatment plants, and industrial boiler installation, cleaning, and maintenance

While the overall markets are large, the company goes after specific niches – according to the management team, the strategy is to “Become the leader in a certain number of selected niche markets” – a characteristic of many hidden champions.

This focus is demonstrated by the company’s description of several subsidiaries:

– “In the environmental sector, we are the European leader”

– “Babcock Wanson is European leader in construction of industrial boilers”

– “LAB is European leader in flue gas treatment for waste incineration”

Each business segment is characterized by complex projects requiring high-tech capabilities and engineering know-how.

CNIM is well-suited for the task of leading these niche technological markets, employing over 1200 engineers out of 3000 total workers – human talent is a real advantage when innovating and delivering on these complex projects.

Another hallmark of a business with a competitive advantage is consistent and sustainable returns – over the past ten years, CNIM’s average ROE is nearly 20% despite maintaining a net cash position for the entire period.

Finally, while many projects are won through a one-time bidding process, CNIM also benefits from recurring revenue:

– After construction, many waste-to-energy plants are operated by CNIM for 20-30 years before the company turns the plant over to local governments.

– In the case of CNIM’s Babcock Wanson subsidiary (a key player in industrial boilers and part of the energy division), over 70% of revenues come from recurring service contracts.

The company’s long history and experience in France is reflected by the fact that former French president, Nicolas Sarkozy, gave his 2009 speech on economic recovery at one of CNIM’s sites.

WTE Industry Overview

Although all three business segments provide meaningful revenue, the Environment division provides the bulk of the profit and is what the company is typically known for – a big portion of this segment is focused on the waste-to-energy (WTE) market.

Active in more than 20 countries, CNIM has built over 140 waste treatment plants around the world in places such as Brussels, London, Paris, Turin, New Jersey USA, and Azerbaijan.

Although there is often public outcry from environmentalists and citizens regarding these plants, industry research and scientific studies have backed incineration as a valid method for dealing with municipal waste – it is also classified as a renewable energy source.

According to the company’s reports, waste incineration is

“…by a long way the cleanest, most efficient and most tightly-controlled industry in Europe, with extremely well monitored residual emissions whose effects on health and the environment in general are recognised as negligible”

Although recycling is still the preferred method for waste management, as much as 60% of municipal waste cannot be recycled or reused in a valid way.

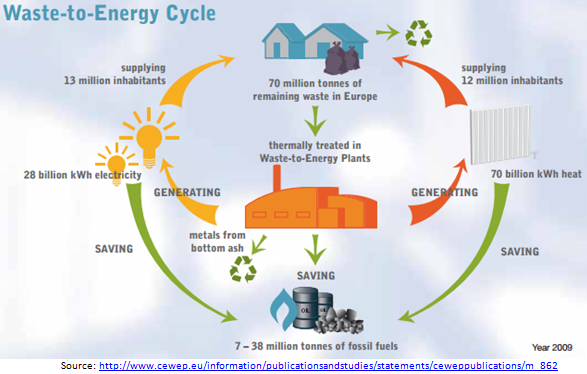
Here is an infographic that explains the waste-to-energy cycle:

CNIM - Waste to Energy Cycle

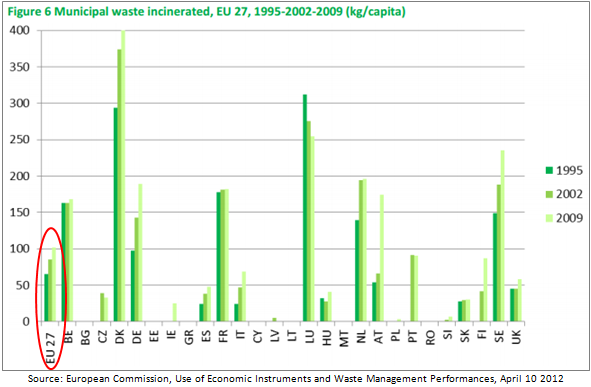
Across the EU27, over 400 such waste-to-energy plants are currently operating (implying a market share for CNIM of 30-35%) – these plants incinerate approximately 22% of total municipal waste and the volume of waste incineration is rising:

CNIM - Municipal Waste Incinerated

However, many countries within the EU27 still have little or no incineration plants, an untapped market for CNIM – one study has the WTE technologies market growing from $6.2B to $29.2B by 2022, or 17% per year.

CNIM’s leadership position in this market was validated in 2010, when the company was recognized as an official partner of the EU’s “Sustainable Energy Europe” campaign for its work in constructing six new energy-to-waste projects.

Investment Thesis

1) Record backlog and book-to-bill ratio points towards continued revenue growth in 2012, while shift in sales mix towards higher margin Environment business will boost profits

At the end of 2011, CNIM’s backlog stood at €1,151m, the highest end of year backlog in the company’s history and a 30% jump over 2010.

CNIM - Backlog

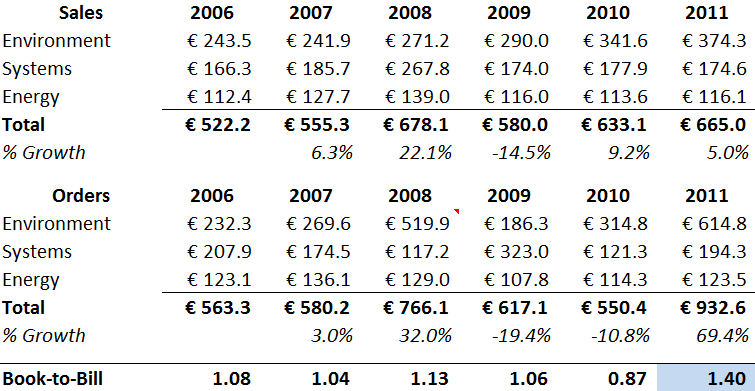
While backlog grew 30%, sales were up only 5%.

Assuming the company can successfully handle the additional business, this divergence in growth rates for sales vs. backlog represents significant revenue potential for CNIM through 2012 and 2013:

CNIM - Sales & Orders

At the end of 2011, CNIM’s book-to-bill ratio was 1.4, 35% higher than the company’s long-term average of 1.04, once again signaling pent-up demand.

Based on Q1 2012 numbers released in May, the strong flow of orders has continued, with backlog rising to a new record of €1290m, 58% higher than the average backlog from 2006-2010.

Although the market is worried about CNIM’s exposure to Europe, these order numbers should lead to significant revenue growth over the coming year or two.

In addition, a closer examination of the backlog mix points towards a shift towards higher margin business lines.

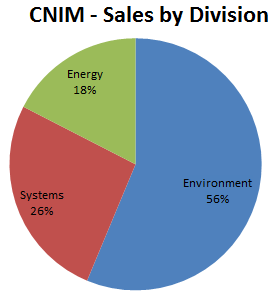
Here is a breakdown of the company’s sales in 2011:

CNIM - Sales by Division

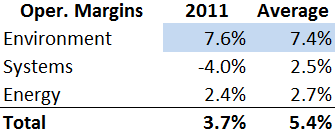
Although Environment business made up 56% of 2011 sales, it represented 71% of total backlog at the end of Q1 2012. Importantly, this division has margins that are almost 3x higher than the other two segments:

CNIM - Operating Margins

This percentage shift should push up the company’s overall margin, resulting in increased operational leverage and improved EPS as revenues rise in 2012-2013.

2) Discontinued operations have obscured the company’s true earnings power, causing the stock to be overlooked by casual investors

In 2009, the company went through a mini restructuring in response to a €7.8m operating loss.

The supervisory board fired the old management team and decided to divest the Transport business (a maker of heavy duty escalators), a segment which had lost money in the previous three years.

Since the decision to sell, the company has managed to liquidate, transfer, or sell a number of the units within the Transport division, but the process has dragged on (the segment had included 9-10 separate companies/subsidiaries, representing over €100m in sales).

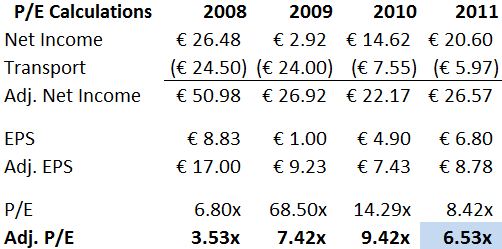
While the Transport division was classified as discontinued operations going back to 2008, a quick glance at the bottom-line earnings number without adjusting for this fact shows a markedly different picture of the company’s valuation:

CNIM - EPS Calculations

While some websites display the adjusted figure, others show a P/E in the 8-9x range, which could cause investors to overlook the stock while using basic screening methods.

3) CNIM’s contract-based and complicated business creates lumpy cash flow figures, despite an attractive double digit FCF yield based on normalized or average figures

In 2011, CNIM reported €52m in operating cash flow offset by €10.7m in capital expenditures, which translated into €41.3m in FCF. With a market cap of €179m, that equates to a FCF yield of 23%.

However, CNIM’s working capital and operating cash flow can shift dramatically from one period to another, depending on the timing and collection of payment for its projects.

For example, a single large order (such as the €346m order to build a waste incineration plant in Azerbaijan in 2008) can cause dramatic swings in the company’s working capital.

Therefore, it is helpful to look at the average cash flow generation of the business over a longer time period.

While CNIM is not a high growth company, capex has outstripped D&A over the past ten years, implying that management has invested back into growth opportunities – an estimate of maintenance capex results in an even lower figure:[1. Maintenance capex was calculated using the Greenwald method of estimating growth capex based on % of PP&E necessary to support revenue growth. See explanation here ] 

CNIM - Capex Calculations

The impact of the Transport division has also affected the company’s cash flow figures – over the past three years, the company has spent €38.1m in cash on discontinued operations:

CNIM - FCF Calculations

Average FCF yield ranges from 8.4% to 25% depending on whether a market cap or EV-based denominator is used – all but the most conservative combination clears a 10% hurdle rate:

CNIM - FCF Yield

Given the current rate environment, any of these FCF yield scenarios is attractive.

4) Business/management has impressive track record of creating value, while the depressed valuation due to Euro crisis presents a buying point far below long-term averages

In the past ten years, CNIM’s management team has been able to growth BV/share from €26.30 to €58.50, for a CAGR of 9.3%.

While this number is good given the time period, it is even more impressive considering the company has paid a large dividend (averaging 40% of total earnings) for a dividend yield of 4-5%.

Looking at it another way: starting from a BV/share of €26.30 in 2002, CNIM paid out dividends/share of €26.00 over the next ten years.

Hypothetically, if an investor picked up shares at BV/share of €26.30, collected the interim dividend payments, and then sold out at the 2011 BV/share of €58.54, the resulting IRR would have been 17% over ten years.

While this exercise shows how management has created value, it is only hypothetical, as the stock price was actually flat from 2002-2011 due to a contraction in the stock’s P/B ratio.

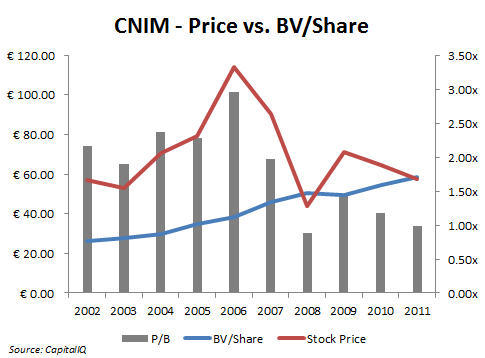
Here is a chart showing the stock price, book value per share, and P/B ratio at the end of each of the past ten years:

CNIM - Price vs BV Share

Despite improving operating results and a steady growth in book value per share, the stock price has been volatile and has not recovered much from the recession lows – the P/B ratio continues to hover around 1x.

At near book value, an investor is picking up a business that has earned an average ROE of 20% over the past ten years, for an implied future return of almost 19%.

Valuation

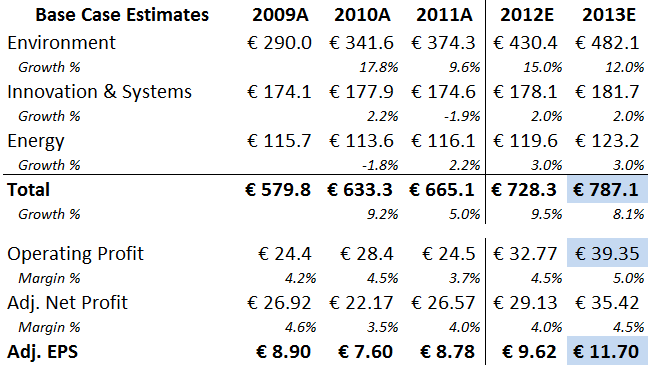
CNIM - Base Case Estimates

In the base case scenario, CNIM generates almost €800m in revenue, operating income of nearly €40m, and EPS of almost €12.00 by 2013.

Assigning a 10x multiple (below the LT P/E multiple of 12x) on this forecasted 2013 EPS would result in a per share price of €117, or 97% upside.

In addition, with the inclusion of expected dividends, the 2-year IRR would be 49% per year.[2. Assumes collection of FY2011, FY2012, & FY2013 dividends. Ex-dividend date for FY2011 is June 29, 2012]

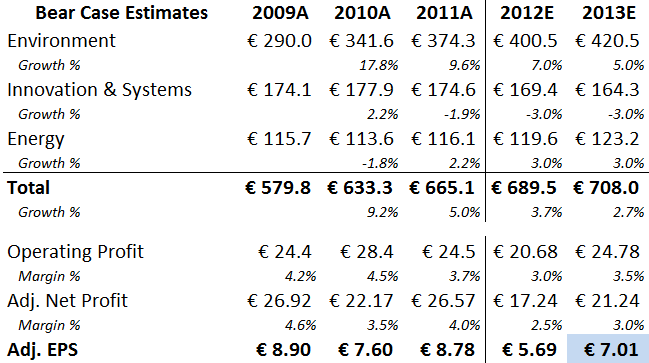
In a bear case, the backlog does not translate into the corresponding sales growth, margins compress further due to project cutbacks, competition, and discontinuation of defense programs, while the P/E multiple stays at its depressed level of 7x:

CNIM - Bear Case Estimates

Even in this extreme example, the share price falls to €49.10, but with dividends included the two-year IRR is still 1.2%, or basically breakeven.

With the company reporting sustained growth in orders and backlog, the likelihood of this scenario seems remote.

More simply, if the stock just returns to trading near its historical averages, the upside is substantial:

CNIM - Valuation Metrics

Risks

1) Growth via acquisition creates risk – CNIM has made a number of acquisitions over the years, and intangibles make up roughly 30% of total equity. Most of the recent acquisitions were small however, and goodwill impairments were negligible even during the depths of the recession.

In 2008, CNIM purchased the Bertin Group for €17.2m (€7.1m in goodwill) – the next year, Bertin had sales of €47m and net income of €5.9m, implying a transaction value of only 3x NTM earnings, a good deal.

2) Uncertainty over new French president – Reform policies by the new president of France, François Hollande, could affect CNIM’s businesses, especially in the Innovation & Systems division, which is tied to government spending and defense contracts.

Hollande has pledged to reduce the budget deficit to zero by 2017, which could entail defense cuts. On the other side, he has also pledged to reduce French dependence on nuclear power in favor of renewable resources, which would boost CNIM’s waste-to-energy business.

3) Family-owned stock with small float – CNIM is a closely-held company with only 29% of shares available to the public. Therefore, liquidity and common shareholder representation could be a concern.

37% of shares are held by the Herlicq and Dmitrieff families, who have family members represented throughout the management team and supervisory board, and have long histories with the company.

Conclusion

Barring a complete and catastrophic meltdown in Europe, the markets are providing an opportunity to pick up a well-run business well below its valuation averages – and near lows not seen since the depths of the 2008/2009 recession.

Not only are investors receiving a double digit FCF yield and a healthy dividend payout, but if the growing backlog translates to the anticipated sales/earnings growth, CNIM should provide an attractive IRR over the next several years.

Disclosure

Long CNIM

Maruka Machinery - Financial Overview

Maruka Machinery is another net-net stock in Japan, but it’s a business capable of producing mid-teens return on capitals and consistent book value growth far above its typical Japanese peer.

With a net cash balance almost equal to the current market cap, investors are basically picking up the business for free – the epitome of downside protection – while enjoying a mid-teens expected future return.

Company Introduction

Despite its name, Maruka Machinery does not manufacture machinery. Instead, it primarily serves as a trading and distribution company for other machinery manufacturers.

The company is divided into two business segments:

Industrial Machines – includes machine tools, injection molding machinery (maybe CMT bought some from Maruka?), agricultural equipment, lathes, food processing equipment, etc.

Construction Machines – includes cranes, excavators, compressors, pile drivers, augers, etc.

The company has been in business for more than 60 years, and has built up a global distribution networking which includes 17 offices through the U.S. and Asia. This global reach helps local Japanese manufacturers reach international customers.

With a local presence in each geographic location, Maruka also offers “before-and-after service” for the equipment it distributions – for example, the company has 8 technical centers in the U.S. alone, a service that local Japanese manufactures are unable to offer their customers alone.

Financial Overview

Maruka has a long history of profitability, recording both an operating and net profit in every year going back to at least 1997. Cash flow has been consistently positive as well, with operating cash flows running approx. 140% of net income over the past ten years.

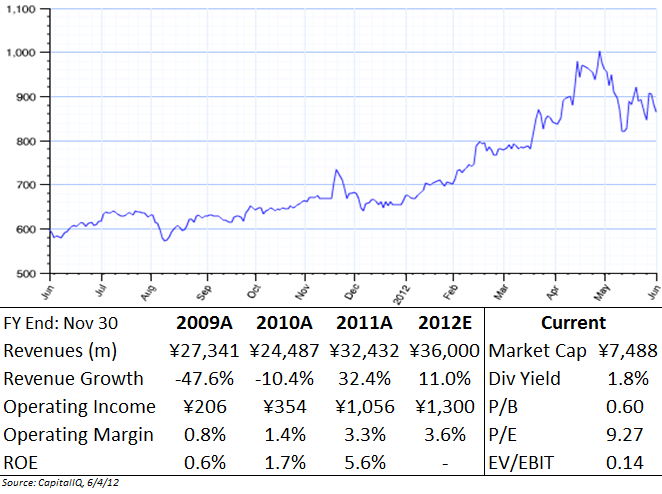
Revenues are cyclical in nature, touching a high of ¥52,167m in 2008 before falling more than 50% during the recession.

2009 and 2010 were especially difficult as ROE fell under 2%, well below the company’s long-term ROE of 8.3%.

However, revenues have shown a steady increase since the recession, and management is expecting double digit growth in both revenue (to ¥36,000m) and operating income (to ¥1,300m) for FY 2012.

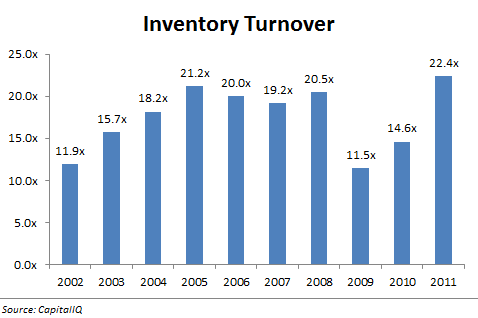
These improving business conditions are also reflected in how fast Maruka turns over its inventory, a key metric for distribution companies that are moving equipment for customers: 

Maruka Machinery - Inventory Turnover

The latest turnover of 22.4xis the highest in the past ten years, showing that the company is quickly moving the product it gets from its suppliers.

Investment Thesis

Unlike many of my other write-ups, the investment case for Maruka is simple: it’s a good business at a very cheap price.

But before going into the valuation, here are some other investment positives:

1. Asset-light business model – Unlike manufacturing companies, Maruka requires little in the way of PP&E, and therefore has to invest much less capital to operate the business.

By comparison, here are Maruka’s numbers against Fuji Oozx, another Japanese net-net which manufactures auto parts:

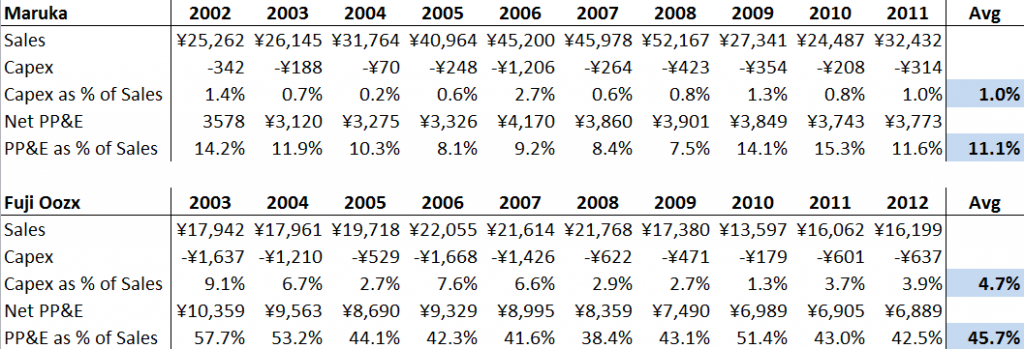
Maruka Machinery - Fuji Oozx Comparison

While the market caps for the two companies are similar, Maruka is producing twice the sales on only ¼ the PP&E. In addition, Fuji requires almost 5x the amount of capex investment each year for an equivalent amount of revenue.

2. Negative cash conversion cycle – Since in 2005, Maruka has enjoyed a negative cash conversion cycle, which describes the cash flows between accounts receivable, inventory, and accounts payable.

With a negative number, Maruka is effectively receiving an interest-free loan from its customers that can be reinvested in the business.

In the past 7 years, this negative cycle has averaged -28.1 days, meaning Maruka has been able to use its suppliers’ cash for almost a month, interest-free.

In Warren Buffett’s 1996 “Owner’s Manual” on investing in Berkshire stock, he describes these interest-free loans as having

“they are liabilities without covenants or due dates attached to them. In effect, they give us the benefit of debt – an ability to have more assets working for us – but saddle us with none of its drawbacks.”

He was talking about float and deferred tax liabilities, but the concept is similar, and this dynamic provides a competitive advantage for Maruka.

3. Export-heavy business – There has been many concerns about the strength of the yen, which has stayed strong despite concerns over the Japanese economy.

Here’s a table breaking down Maruka’s sales by country over the past 5 years:

Maruka Machinery - Sales by Geography

Although exports have always been a significant portion of total sales, they passed 50% of the total in 2011 for the first time. While the Japanese market is still significantly below its all-time highs, the company has seen a large fall in its second largest market, North America – a decline due in part to the strong yen.

Many experts are predicting that the yen will weaken over the coming years, which will help boost international sales for Maruka and other Japanese exporters.

As a U.S. investor, improved performance by exporters in a declining yen scenario serves somewhat as a proxy for a yen ‘hedge’ on the underlying currency.

Valuation

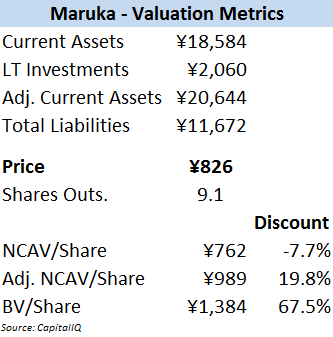
As with my other Japanese investments, Maruka is cheap on nearly every valuation metric:

Maruka Machinery - Valuation Metrics

While Maruka doesn’t fall into the strictest definition of net-net investing (Current Assets – Current Liabilities) the company also has ¥2,060 in LT investments (i.e. bonds) that are included in the adjusted NCAV calculation.

Regardless, the company is extremely undervalued, especially compared with its long history of profitability.

While Maruka isn’t quite as cheap as some other Japanese net-nets, I prefer it for several reasons:

– Despite being way overcapitalized, the company earnings a decent ROE (at least for Japan), with an average of 8.3% over the past ten years. At 0.7x of book value, the expected future return is almost 13% – if business results improve as expected, this should end up far higher.

– Maruka has exhibited growth in the past and has proven the ability to deliver revenue and profit figures 50% or more above current levels – basically, there is room to grow. Many other Japanese net-nets have not demonstrated this ability.

– Along with top-line growth potential, Maruka’s business model allows it to deliver above average ROIC – 16% on average over the past ten years. Although cyclical, this is a good business, capable of earning extremely high ROIC of 25%+ during upswings.

Conclusion

Some of my other recent investments in Japan are even cheaper than Maruka (both on a balance sheet and expected returns basis), but there are several aspects of Maruka’s business (export-heavy, asset-light model) that are attractive given the current economic and political situation in Japan.

In fact, there are other Japanese net-nets that are even cheaper than my holdings, but many of them are subpar businesses earning 1-2% ROE per year – those businesses are consistently profitable, but the income statement looks more or less like it always does, and there is no growth.

If it’s a choice between a quality business at $0.60 on the dollar vs. a below average but consistently profitable business at $0.40 on the dollar, I’m choosing the former.

Stay tuned for several other Japanese ideas.

Disclosure

Long Maruka Machinery

CMT - Financial Overview

Company Background

Core Molding Technologies (AMEX:CMT) is a manufacturing business that focuses on reinforced plastics – a type of plastic that is combined with a reinforcing fiber (like glass or carbon) and then molded into shape.

CMT makes sheet molding compound (SMC), a major input into compression molded products, and therefore controls the production process through its five facilities in the U.S. and Mexico.

These facilities encompass over 1M square feet of manufacturing space, making the company one of the four largest compounders and molders of reinforced plastics.

Reinforced plastics are used in the transportation, construction, marine, and industrial markets, but the primary use is for trucking – sales to the trucking industry made up 91% of CMT’s sales in 2011.

CMT was formed in 1996 for the express purpose of purchasing the Columbus Plastics unit from Navistar (a major truck company), a relationship which continues to this day – Navistar remains a major shareholder and accounts for 44% of sales.

Investment Thesis

#1) Highest recorded age of trucking fleet, combined with new orders still at or below replacement rate, point towards continued revenue growth for CMT

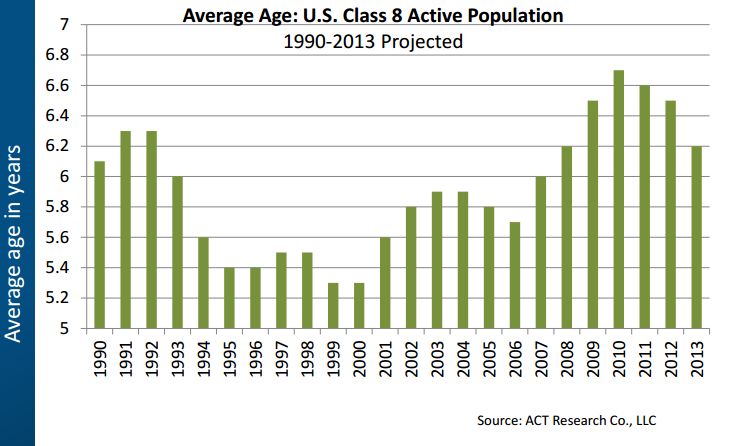
In 2010, the average age of the U.S. trucking fleet was 6.7 years, the highest in history, and industry experts are projecting a gradual decline in fleet age due to an increase in new truck orders:

CMT - Average Age of Trucking Fleet

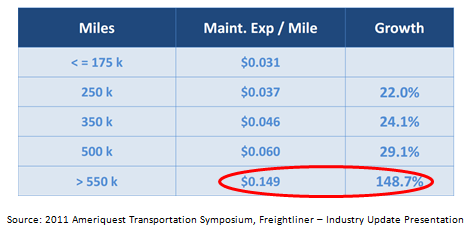
This growth is driven by the fact that such an old fleet cannot be maintained because of exponentially increasing maintenance costs as trucks get older:

CMT - Truck Maintenance Expenses Per Mile

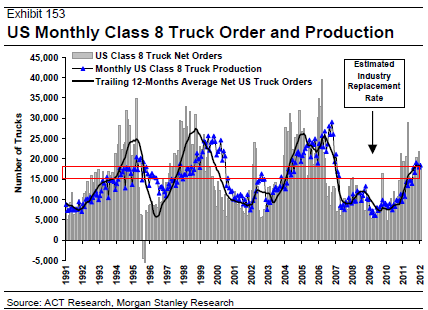
This dynamic is reflected by the run-up in truck orders since the 2009 lows, but the industry is barely at replacement rate and far below previous peaks in the trucking cycle:

CMT - Class 8 Truck Order and Production

March and April truck order numbers came in below expectations, but according the ACT Research, a leading market research firm, expectations remain bullish for 2012 (with truck orders forecasted at 299,000 annual units, or ~25k per month), along with expected strong demand into 2013 and 2014:

“our expectations for the cycle peak in 2013 are shallower with stronger demand now stretching through 2014.”

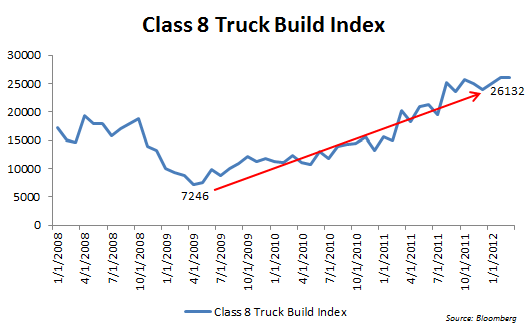
This is backed by the strong upward trend in truck builds: 

CMT - Class 8 Truck Build Index

This bullish industry outlook should provide ample runway for revenue growth at CMT for at least the next two years.

#2) Investments in manufacturing and capacity expansion have raised capex significantly above maintenance levels, whereas normalizing these numbers showcases CMT’s strong free cash flow generation

CMT - Free Cash Flow Calculations

Average FCFE over the past ten years was $3.8mm, a FCF yield of 6.6% based on a market cap of $57.3mm.

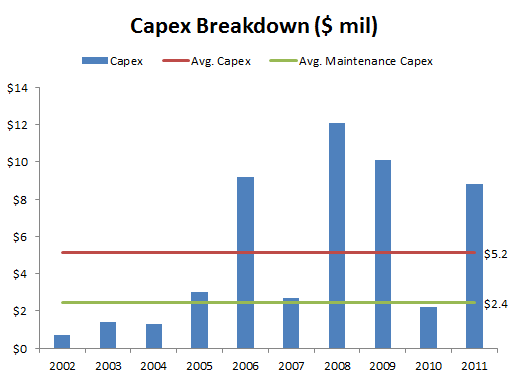
However, this average number is skewed by several major expansion projects which have doubled average capex over the past four years:

2009: CMT opened a 476k sq. ft. manufacturing plant in Matamoros, Mexico, transitioning from a formerly leased space. A $20.2mm project, the new facility increased floor space in the region by 43%.

2010: the company announced a major expansion of the Mexico facility in order to handle increased order flow and new product launches. The project is expected to cost $14.5mm, with $6.3mm spent so far in 2011.

2011: CMT leased a new 62k sq. ft. facility in Warsaw, Kentucky for its Core Specialty Composites division, which was created to produce parts for customers outside of the trucking industry. The company spent $1.2mm on leasehold improvements for this new facility, and management expects that the Kentucky facility will be fully operational by mid-2012.

Here’s the a breakdown in capital expenditures in chart form: 

CMT - Capex Breakdown

Of the $51.5mm in total capex spend over the last ten years, $27.7mm was spent specifically on growth/expansion projects.

After subtracting out these growth investments, average maintenance capex is only $2.4mm (which also happens to more closely resemble average D&A of $3mm).

Using average maintenance capex, a normalized FCF number is around $6.5mm, for an adjusted FCF yield of 11.3%.

#3) Capacity gains plus efficiency improvements have transitioned CMT from below-average to above-average business since the previous upswing in trucking cycle

By a variety of metrics, CMT is operating more efficiently now than ever before in its history, especially at this stage of the trucking cycle.

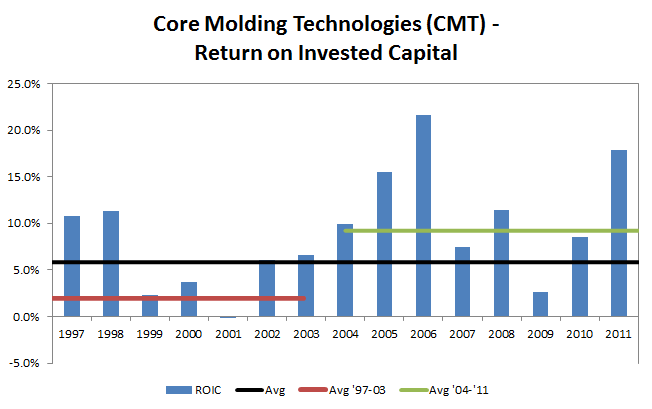
Since 2003, ROE has averaged 17.48%, compared to an average of 8.99% in the previous seven years. Looking at similar time periods, average ROIC has increased from 5.8% from ’97-’03 to 11.8% for ’04-’11, as showcased in the graph below: 

CMT - Return on Invested Capital

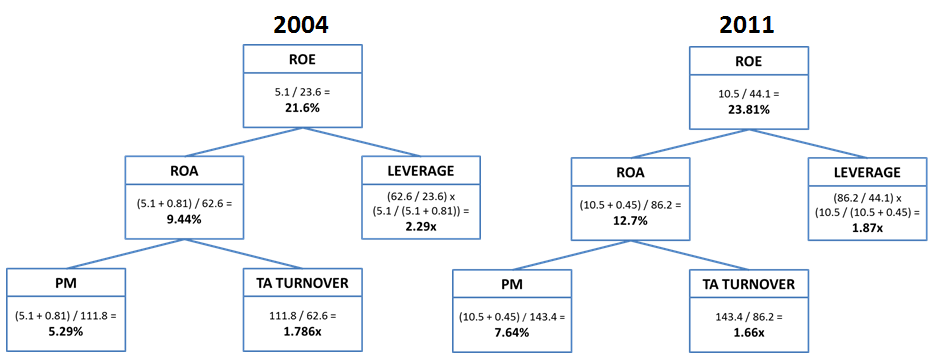
Another illustration would be a DuPont breakdown – 2011 results are similar to 2004, another good year for CMT and at a similar point in the trucking cycle: 

CMT - ROE Decomposition

The ROE decomposition clearly shows an improving ROA, driven largely by higher profit margins. It also shows the decrease in leverage – while total debt is nearly identical in 2004 and 2011, CMT is paying a much lower interest rate.

Asset turnover is down slightly, but that is to be expected. In 2001-2004, the company had no major expansion projects and capex was low.

However, CMT has invested heavily in new assets over the past several years – as those assets come online and become fully operational, turnover should increase and operational leverage will kick in, boosting returns even further.

#4) Investments in high-end machinery (i.e. plastic presses > 2000 tons) provide a competitve advantage, and should help CMT maintain higher average margins through the next cycle

According to the company’s SEC filings, CMT

possesses a significant portion of the large platen, high tonnage molding capacity in the industry.

These large presses weigh over 2,000 tons, and are used for the largest molding projects. As of December 31, 2011, the company owned 18 large presses, with 2 more planned for purchase in 2012.

At this size range, even a 10+ year old used press sells for $500k or more, so a competitor would be looking at investments in the tens of millions of dollars in order to compete with CMT for the larger press jobs.

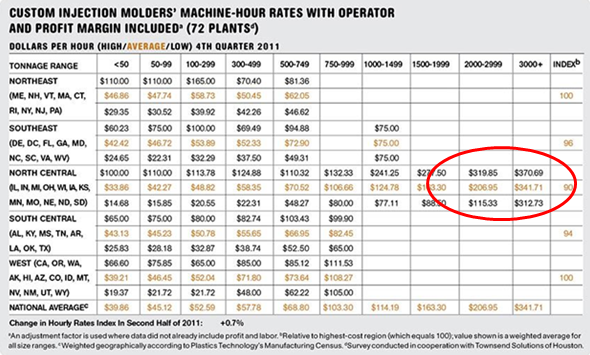
The the chart below shows the increase in machine-hour rates for a range of plastic molding machine sizes:

CMT - Machine Hour Rates for Plastic Injection Molding Machines

Presses greater than 2,000 tons command a 4x-7x price premium over smaller machines.

This shift towards larger, higher value machines could help explain the uptick in CMT’s margins – average gross margins are running roughly 200 basis points above the previous cycle, and the 2011 GM of 20.8% was the highest since 1997.

An increasing gross margin does indicate some pricing power for CMT, and investments in these higher-end machines point towards a structural – not temporary – shift to higher margin business.

Management

Management is well-paid, but has a solid long-term track record – Over the past 10 years, CMT has grown book value per share at 15.5% annually.

The C-suite executives have demonstrated tremendous loyalty to the company, as all joined shortly after inception and have been with the company for 13-15 years. Insiders hold 11.6% of shares outstanding.

Two other well-respected value-oriented investment firms, GAMCO and Rutabaga Capital, own 14.1% and 9.5% of shares respectively. Navistar retains a 9.2% ownership stake, even after CMT bought back and retired 3.6mm shares from Navistar in 2007.

In addition to some stock options and restricted units, the company also leverages a profit sharing plan as part of its compensation. The plan kicks in after achieving an 8% hurdle rate on a ratio of EBT / Adjusted Average Total Assets, and is capped at 20% of EBT – the ratio produces result similar to ROIC.

While the 8% hurdle rate might be a bit low, the plan is much more reasonable than many other compensation schemes out there.

Risks

While there are risks with the company executing on its expansion projects, or gauging the exact stage of the trucking cycle, the most critical risk is customer concentration.

PACCAR and Navistar, two of the largest class 8 trucking companies, make up 80% of CMT’s sales. Put simply, losing either customer would be a major setback.

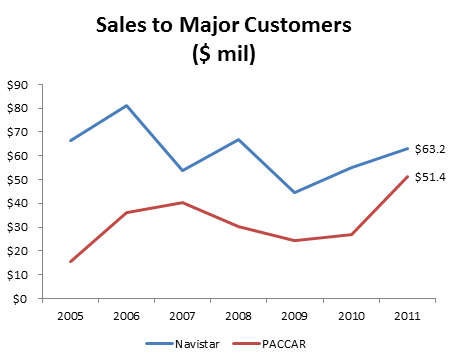
Here is a breakdown of CMT’s sales to its two largest customers: 

CMT - Sales to Major Customers

PACCAR is becoming an increasingly important part of CMT’s business, and now makes up 36% of sales versus 44% for Navistar.

Despite the customer concentration, CMT has a long relationship with both of its major customers:

Navistar

CMT has been associated with Navistar since 1996, as the company’s founding purpose was to acquire the Plastics division from Navistar. CMT also signed a comprehensive supply agreement with Navistar in June 2008, which was renewed in Jan. 2010.

Under the agreement, CMT

“continues to be the primary supplier of Navistar’s original equipment and service requirements for fiberglass reinforced parts, as long as the Company remains competitive in cost, quality and delivery.”

The agreement is up for renewal in October 2013, but the non-renewal risk is mitigated by several factors:

  1. Navistar remains a significant investor and shareholder of the company, holding 9.2% of shares outstanding. The current Chairman of the board (and former CEO of CMT), was a VP of Navistar from 1992-1998 and presumably retains some key relationships there. In addition, another board member, Thomas Cellitti, is Navistar’s SVP of Reliability & Quality, and has been on CMT’s board since 2000.
  2. As part of the amended supply agreement, CMT moved production from its Ohio facilities to its Mexico plant in order to more effectively supply Navistar’s Mexican operations. This was a costly move, and CMT has invested millions more in expanding the Mexican facility.

It’s unlikely that management would take such drastic steps unless they were reasonable assured that a supply deal would be re-signed.

PACCAR

While CMT has no formal relationship, PACCAR has been a named customer going back to at least 2005. In addition, recent sales results show a positive growth trend lending credence to the assumption that CMT is becoming a more important supplier.

In 2011, sales to PACCAR were up 97%, achieving a record of $51.4mm. This was $11.1mm, or 28%, greater than the previous high set in 2007.

Health of Navistar / PACCAR

Of the two, PACCAR seems to be the better-run company, but both enjoy a healthy percentage of the overall truck market in North America.

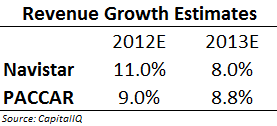
Both customers are expected to grow at a healthy clip over the next 2 years: 

CMT - Major Customers Revenue Growth Estimates

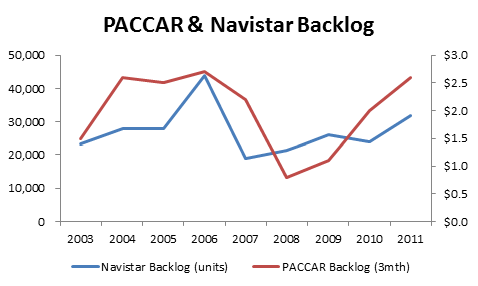
These revenue growth expectations are backed by increasing backlog as of the end of 2011. 

CMT - Major Customers Backlog

Navistar’s backlog of 32,000 units was the highest since 2006 while PACCAR’s 3-month backlog of $2.6B was just shy of the record of $2.7B in 2006.

Both companies were bullish in their latest disclosures and conference calls:

Navistar Analyst Day – Feb 2012

“We’re saying right now that our 2012 industry forecast is, give or take, a 15% increase over 2011. But we believe that 2013 and ’14 will again have increased volumes from an industry standpoint”

“We think that there’s an opportunity to grow our market share by about 10%. So we’re — we’ve — we finished the year around 21%”

PACCAR Q4 Conference Call – April 2012

“U.S. and Canadian industry retail sales are estimated to improve this year to a range of 210,000 to 240,000 units, up from 197,000 last year. This is being driven by ongoing replacement of the aging truck fleet and some economic growth”

“I think people are just — they’re buying what they need. They certainly recognize the very tangible benefits of having a new truck versus a truck that’s 5, 6, 7, 8 years old. That can be measured in thousands of dollars per year.”

Other Customers

While CMT is heavily dependent on Navistar and PACCAR, sales to other customers (primarily other major truck manufactures) increased 57% to $18.3mm in 2011.

This is an encouraging sign, and there appears to be further runway to diversify based on results from prior years (for example, sales outside of the big 2 were $45mm in 2006).

In addition, the Kentucky operation was created in order to further diversify outside of the core business segments, lessening the concentration risk.

Valuation

CMT does not have a useful public comp in North America, so instead a comparison can be done based on the company’s historical averages: 

CMT - Historical Valuation

A normal P/B multiple of 1.4x would yield a share price of $10.46 (40% upside), while an average EV/EBITDA multiple of 6x would yield a share price of $16.12 (105% upside).

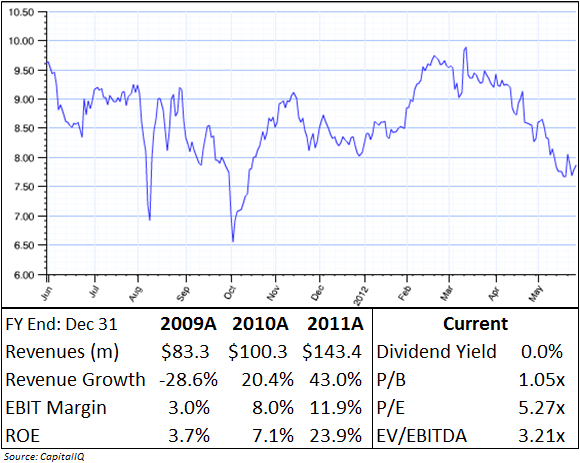
At TTM 5.3x P/E, the current valuations is overly pessimistic, and represents a state more similar to an industry on a cyclical downswing – a stage of the trucking cycle that is unlikely given:

(1) the size and increasing nature of order backlogs (both at CMT and its major customer)

(2) the extreme age of the current trucking fleet

(3) double digit growth forecasted by industry expert and confirmed by major truck manufacturers

(4) an order rate still below the truck replacement rate and well below past peaks in cycle

Catalysts

  • Record year-end backlog leads to another huge revenue year – Backlog of $15.2mm at year-end 2011 is a record number, and 29% higher than previous record of $11.8mm in 2005. By comparison, the 2005 backlog translated into 2006 revenue of $162mm, a mark which should be surpassed in 2012. Q1 2012 sales were up 53%, confirming this trend.
  • Additional manufacturing capacity comes online in 2012, boosting revenue growth even further – The Kentucky plant alone is expected to contribute $5-8mm in incremental annual revenue once it becomes operational in 2012
  • Additional product sales cover larger investment in fixed costs and capacity, and operational leverage boosts income – Net PP&E is over 50% of total assets, so the business is inherently leveraged, and volume increases will translate to an even greater jump in EPS
  • Multiple expansion boosts stock price as strong results confirm that trucking market cyclical upswing continues

Conclusion

Purchasing CMT is an opportunity to pick up a well-run company at a 10%+ normalized FCF yield and a discount to long-term valuation multiples at an attractive point in the trucking cycle.

In the Q1 2012 earnings report, revenue growth materialized as expected, but margins were hurt by “production inefficiencies and startup costs.

Based on the long-term track record, management has proven the ability to deal with these operational hiccups and the recent sell-off presents an attractive entry point – the company should report strong bottom-line results for FY2012 as operational leverage improves.

Disclosure

Long CMT