2012 Portfolio Review

Posted February 1st, 2013. Filed under Holdings

2012 marked another year of solid performance, especially given an average cash balance of ~20%:

Value Uncovered Portfolio - 2012 Year End Review

The total number of positions in the portfolio has crept upwards, with 29 stocks at year-end. The majority of trading activity occurred in existing holdings, with just 6 new additions. Two stocks (APNC, NOOF) were acquired during the year.

As mentioned in my last review, 2011 was the first time I branched out into international stocks and it has been a major point of emphasis over the last twelve months. Today, 47% of my portfolio is now outside of the U.S., and I continue to look for opportunities overseas.

With a hat-tip to the blog at the red corner for the idea of mimicking Buffett’s ‘look-through earnings’, here is how the portfolio would stack up as a mini-conglomerate (on a weighted average basis):

Value Uncovered Portfolio Aggregate Stats - 2012

A few comments on these numbers:

– 5% sales CAGR. This definitely won’t be mistaken for a growth portfolio. However, the majority of holdings are trading below a conservative ‘no-growth’ value, so anything beyond inflation is upside. I rarely have confidence in forecasting future growth, so I try to avoid paying for it.

– 9% trailing earnings yield. Since companies within the portfolio are generally net cash positive (in the case of the net-nets, in a rather extreme way), this trailing figure is actually understated as the yield to enterprise value would be much higher.

– 85% FCF conversion. Over the last ten years, the holdings have converted 85% of earnings into free cash flow. Little reinvestment is required to support growth, so FCF is available for share repurchases or dividends.

– 26% normalized ROIC. Outside of 1 or 2 exceptions (a net-net and a turnaround or two), all of the businesses are earning acceptable returns. As a group, normalized ROIC is substantially higher than the cost of capital, indicating that many positions have some sort of a competitive advantage or at least a leadership position in a niche market.

– 38% RONIC. Incremental returns on capital are higher than current returns, so growth is adding to shareholder value.

Final Thoughts

As some of you might have noticed, I took a hiatus from the blog for several months, as I continue to pursue investing as a full-time career. My prospects are shaping up even better than I could have hoped, but it has taken time away from posting on the blog.

But the main reason for the lack of posts is the strong market in 2012 (followed by another ~5% upswing in January alone), which has pushed up valuations on many stocks outside of my comfort zone, especially in the U.S. Viewing the market on a bottoms-up basis, stocks within my circle of competence look expensive – basically, not much looks interesting right now.

Therefore, I have been spending time reexamining each position within the existing portfolio, while building a watch list of high-quality businesses. While sitting on cash and showing patience does not make for very good blog reading, it will hopefully be rewarded on the inevitable pullback.

Tessi - Financial Analysis & Price Chart

Owner-operator companies are those controlled by a significant, typically the largest, shareholder. This is a person with a great deal, perhaps most, of their personal capital at risk in that business…Businesses managed by their founders and/or largest shareholders tend to have much more liquid balance sheets, are more opportunistic, and exhibit remarkably higher long-term results.” – Murray Stahl, Chairman of FRMO Corp

Tessi (TES.PA) is a family-owned firm with a leading market position for high volume document processing in France.

Essentially, Tessi allows large companies to outsource the manual and often tedious task of handling and processing large volumes of physical documents. Through an acquisition, the company is also the leading wholesaler of gold and currency in France.

Operations are broken out into three business segments:

Document Processing – #1 market share leader in France for check processing and document digitization (converting physical checks or other documents to electronic form). While check processing is a declining business, the transition from physical-to-digital documents is a growth area. The company handles hundreds of millions of documents per year.

Core advantages: established customer relationships (why switch outsourcers in the middle of a 100 million document conversion?), available manpower, scale/efficiency

Marketing Services Operation – handles marketing functions such as redeeming rebates/coupons, processing customer gift fulfillments, executing mail campaign, and staffing call centers.

Core advantages: None really, lots of competition. Breakeven business but with a small “float” (see below)

CPoR Devises – acquired in 2005, CPoR is a broker of foreign currency and gold reserves, serving as the principal supplier in France. TES collects revenues from banks for holding reserves in its vaults, along with taking a fee for transactions between third parties.

Core advantages: sole supplier in France for these transactions, blessed by the French government, fixed investments in security/vaults, regulatory hurdles, reputation

Historical Track Record

Through a combination of acquisitions and organic growth, Tessi has turned in an enviable long-term track record under the current management team.

Since 2002, management has compounded revenues, operating income, and book value at 13%, 22% and 18% respectively.

Tessi - Financial Results

Much of the growth associated with Tessi’s document/marketing businesses is due to acquisitions, as the company has taken out smaller competitors (scale is important in this business) and branched out into ancillary services.

These acquisitions are usually the ‘bolt-on’ variety, most often between €1-20 million in sales, a size capable of being easily integrated into Tessi’s infrastructure.

High Quality Business

Tessi’s businesses are attractive in two major ways:

1) The “float” from the marketing division – While Tessi has no competitive advantage in this space (as evidenced by the breakeven result), the marketing operation is setup so that customers prepay for campaigns, but consumer redemptions often occur weeks or months later.

Assuming TES signs on new customers, this cash advance reduces the need for external financing (effectively, Tessi can self-finance part of operations) – this marketing “float” has averaged roughly €20 million per year.

2) Asset-light business, especially in CPoR – Tessi supports €262 million in sales with just €22 million in net fixed assets.

Documents/marketing (the core business) is service-based. For CPoR, once the infrastructure/vaults/security is in place, there is little additional investment requirements as Tessi’s “product” in CPoR is essentially currency and/or gold – therefore, the cost of handling incremental transactions is negligible.

Combine these factors together and Tessi is generating ROIC north of 50%:

Tessi - ROIC Calculation

CPoR Acquisition = Game Changer

“Admittedly, when people a century from now are fearful, it’s likely many will still rush to gold.” – Warren Buffett, Berkshire Hathaway

“The world seems more uncertain today than at any other time in my life.”– Howard Marks, Oaktree Capital

In 2005, TES paid €41 million for 80% of CPoR Billets (now CPoR Devises) in a break from its traditional document/marketing focus. The remaining 20% ownership is held by Crédit Agricole, which plans to eventually divest its stake.

CPoR supplies gold and foreign currency to all of France’s banking and financial institutions, with a market shares of 90% in forex and 95% in gold.

Dominant market share + little capital requirements = high margins/returns

In 2011, Tessi’s CPoR segment generated €27.4 million in operating profit at 43.6% margins from just €16.5 million in assets, for an ROA of 166%. As a broker, CPoR is leveraged to both price and volume of gold transactions, so in times of crises, results are boosted doubly.

With investor’s traditional view of gold as a safe haven, CPoR serves as a natural hedge during market crashes. As evidence, CPoR grew right through the recession, with margins increasing 1300bps in the last five years: 

Tessi - CPoR Financial Analysis

Gold investment statistics also show the demand increase since 2008:

Tessi - Gold Investment Demand

This increased demand has driven up gold prices:

Tessi - Weekly Gold Prices

Here is the revenue breakdown of the CPoR division through 2006 (TES does not break out profit-level details between gold and forex):

Tessi - CPoR Revenue Breakdown

Margins have improved dramatically as gold has become a greater percentage of CPoR’s overall results.

Critically, the market is pricing in a decline in this business, as analysts are forecasting negative 5-7% annual growth in CPoR revenues from 2012-2014.

In order for revenues to fall by this amount, CPoR would have to see a decline in either gold volume or gold prices that was not counterbalanced by an increase in the other component.

Here’s how the company is doing on those two fronts:

Gold Prices

Tessi - CPoR Ingot Prices YoY

While prices have moderated in the last several months, average gold prices are still 17.5% above 2011 levels.

Gold Volumes

Tessi handled 15 million tonnes of gold in 2010. While volume was not disclosed in 2011, CPoR revenues grew by 36%.

In 2011, average gold prices were up 22%, which would imply an 11.7% increase in volume (this analysis is overly simplistic, but should be directionally correct):

Tessi - CPoR Gold Revenue Analysis

Considering the YoY increase in gold prices for 2012, volumes would have to decreases markedly (by around 15%) for gold revenues to stay flat – and fall even further to justify analysts’ poor outlook.

Through the first six months of 2012, CPoR revenues were up 5.6% YoY, only to fall behind with the Q3 report. It is unclear whether this was due to gold or forex.

However, there are other factors that could mitigate this trend in Q4 and into 2013, lending credence to the possibility that analysts are being overly conservative:

The roll-out of more affordable gold ingots: CPoR released a series of very popular 50-500g ingots in 2011, which generated 2.4 million tonnes of new business in their first year. Last month, the company released a 5g, 10g and 20g version. With prices now starting as low as €225, these new ingots are within reach of many more people and volumes should improve (possibly dramatically) in Q4 and beyond.

The improving tax environment for gold: Historically, sales of physical gold in France were taxed at a flat-rate of 8% regardless of whether the sale generated a gain or loss, which limited demand. In September 2012, a law was passed which modified the tax treatment for gold, increasing the attractiveness for new investors by offering a:

  • Choice of the most advantageous taxation system (either the 8% flat-tax or a 34.5% capital gain), depending on the gain obtained and the holding period
  • Total tax exemption after a period of 12 years
  • No tax due in the event of a capital loss, irrespective of the holding period

Since 2011 was such a record-breaking year for CPoR, similar growth is unlikely – at the same time, annual revenue declines of 5-7% and margin contraction of 500-700bps (what the Street is forecasting) seems too pessimistic as well.

Valuation

Here are relevant comps for the marketing/document (core) side of Tessi:

Tessi - Comp Valuation

Assuming the core business grows at 3% with 10% margins, the fair market value of this segment alone would be €133 million versus Tessi’s market cap of €200 million:

Tessi - Core Segment Valuation

Therefore, a buyer in Tessi gets a stake in CPoR – a business that enjoys 40%+ margins, 50%+ ROIC and a monopoly position in its niche market – for €67 million, or less than 4x earnings.

Here is how the valuation of CPoR might break down:

Tessi - CPoR Valuation Sensitivity Analysis

If current earnings continue, CPoR is worth €160-252 million (midpoint of €206), or 4-6x its implied price.

Even if I’m wrong and both gold demand and prices drop sharply – i.e. margins/NOPAT fall to pre-crisis levels – CPoR is still worth at least 150% more.

Here is a sum-of-the-parts valuation:

Tessi - SOTP Analysis

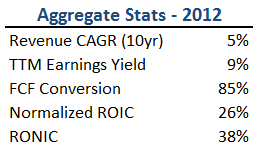
As a sanity check, Tessi has been able to convert an average of 131% of earnings into FCF over the past ten years.

With ’12 earnings estimated in the €30-31 million range, Tessi should generate close to €40 million in FCF, for a yield of 20.1%.

Add in inflation (2%) and organic growth (3-5%), and Tessi’s forward FCF yield is north of 25%.

Conclusion

“What I’m telling you is that the bulk of the return of the indices—and not just in the United States, but in all nations, the bulk of the return was earned by these owner-operators.” – Murray Stahl, Chairman of FRMO Corp.

Marc Rebouah is the Chairman and CEO of Tessi, controlling just over 50% of shares outstanding. Tessi is a classic owner-operator (Rebouah has been in charge since he purchased Tessi in 1979), and demonstrates how much value can be created by a smart management team combined with a long-term view.

Rebouah is now 68 years old, and according to company bylaws, he has to step down as Chairman in January 2014. A sale of the company is a possibility, but I’m hopeful that current management will remain involved in strategic decisions at some level.

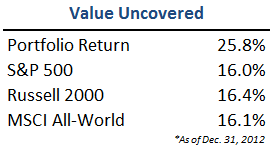
If the next ten years are even half as good as the prior, an investment in TES should work out quite satisfactory…

Disclosure

Long Tessi (TES)


UMS - Financial Overview

Company Overview

UMS United Medical (ETR:UMS) is a medical equipment service provider, focused on mobile service solutions – think “medical equipment on wheels”. Customers include hospitals, ambulatory service centers and physicians’ offices.

The company is broken out into three business segments, focused on different service areas: Urology (kidney stones), Gynecology (breast biopsy), and Other (namely Radiology services)

The most important division is Urology, which accounts for approx. 70% of revenues and 80% of operating profit:

UMS - Segment Financials

Medical Technology Overview

The Urology segment primarily focuses on a technology called extracorporeal shock wave lithotripsy (ESWL), a non-invasive treatment of kidney stones using an acoustic pulse.

The technology has been around for almost 30 years and is considered a standard of care for treatable kidney stones.

However, ESWL isn’t a high-growth industry (at least in UMS’ niche), with the number of UMS patients growing each year roughly in line with inflation:

UMS - Kidney Stone Patients

UMS targets medical services where the capital expense for the technology (which can range into the millions of dollars) cannot be justified by the volume of expected patients.

Corporate Structure

UMS International is a German-based company, but the majority of operations occur in the U.S via wholly and partially owned subsidiary companies.

A crucial part of the business model is the formation of partnerships with physicians, creating a shared ownership around the success of the mobile initiative and an economic incentive for both parties to maximize utilization of UMS’ machines.

UMS has over twenty of these partnerships spread across the country, with most rolling up into the U.S. subsidiary.

UMS usually takes a 10-25% ownership stake in these partnerships but retains management control, and therefore consolidates the subsidiaries on its own financial statements.

The portion of earnings attributable to the physicians (paid out as dividends) is included on the financials as non-controlling interests (NCI), which represents a significant portion of the overall balance sheet.

However, the parent company is the entity that purchases the machines, pays for gas to transport them to each location, accounts for the depreciation, etc.

This means that each partnership on its own right is extremely profitable relative to capital invested, since its costs are essentially just management/rental fees back to UMS.

Approximately 60-70% of UMS’ total earnings go towards paying out NCI.

Ownership

UMS - Insider Ownership

Board members and management hold 39% of shares, up quite a bit from the IPO due to share repurchases over the last several years.

In 2011,  less than €300k was spent on compensation for the management and supervisory boards, a number which is dwarfed by their ownership stake in the company (worth tens of millions).

Therefore, management should be incentivized to allocate capital in the most effective way for all shareholders. The presence of two investment funds, Union Investment and Capiton Value, should also ensure that management continues to grow shareholder value.

Investment Thesis

1. UMS is a ‘broken IPO,’ as losses from a failed international expansion led to frustrated selling, obscuring the value created over the past five years

UMS went public back in July 2000 for almost €25 per share, but fell to only €1/share by early 2003, a loss of 95%:

UMS - IPO Price Chart

In the first four years as a public security, UMS reported net losses of €16.7M, €2.5M, €2.1M and €9.7M.

While most of the losses occurred below the operating line – consisting of restructuring charges, asset writedowns, and goodwill impairments – it was not exactly the best start to its public company life, likely scarring its original shareholder base.

During this time, UMS attempted to expand business operations across Europe, making heavy investments in new technologies (such as PET scans) and new offices in foreign countries.

Unfortunately, the company ran into challenges due to the “non-reform of “encrusted” state-run healthcare systems & lack of insurance coverage.

By 2007, UMS had sold off its European operations and divested non-core business segments, and subsequently started focusing exclusively on the U.S.

While revenues were cut almost in half by the divestitures, profitability improved:

UMS - Historical Earnings Per Share

And the balance sheet was strengthened dramatically:

UMS - Debt Position

While the share price is up significantly over the past year, the market still seems to be ignoring the cash generation ability of the refocused business.

2. Economics of transportable medical procedures business model is attractive for patients, physicians, hospitals and UMS shareholders

These medical machines are expensive, and major hospitals often cannot justify the capital expenditure based on the projected patient volume – the usual alternative is to send the patient to another facility.

UMS transportable model allows hospitals to ‘rent’ the medical device for a daily rate (say on every 3rd Thursday), providing the needed services to patients in a cost-effective way.

UMS receives management and equipment fees from the hospital and its physician partnerships. Since UMS’ mobile units are able to serve multiple sites, the company is able to drive up the overall asset utilization of the machines.

Everyone benefits:

  • Hospitals avoid major capital expenditures
  • Patients receive required treatment at lower cost/procedure and without traveling to another location
  • Physicians create a new revenue stream by offering additional services
  • Shareholders participate in the earnings stability afforded by long-term contracts and steady patient volume

According to the company’s research, the economics of the mobile units are attractive, providing services at a fraction of the cost over a five year period:

UMS - Mobile vs Fixed Sites Cost Analysis

In the last five years, UMS has shifted its capital allocation policy from ill-fated growth initiatives to a strategy of returning cash flow to shareholders via aggressive stock buybacks and dividends

From 2002-2006, the company spent an average of €5.9M per year on acquisitions in attempt to expand around the world. After years of losses, UMS curtailed the acquisition-fueled growth strategy to focus instead on returning cash to shareholders, with small tuck-in acquisitions along the way.

This shift is represented in management’s new capital allocation record – the company spent €0.9M/yr on acquisitions in the past five years, with the bulk of the remaining FCF being returned to shareholders.

This represents a marked shift from ‘empire building’ to a focus on shareholder returns.

The change in policy coincides with Union Investment Funds (a large European asset management firm with €180B+ in AUM) taking a 5% stake in the stock in 2007/2008.

Since that time, UMS has aggressively bought back shares via open market repurchases and tender offers. Total shares outstanding have fallen from 6M to 4.8M, or more than 20%.

UMS paid its first dividend to shareholders in 2010, offering an average dividend yield of over 6% – if share repurchases are included, total cash returned to shareholders yields greater than 10%.

UMS - Dividends & Buybacks

Valuation

UMS - Historical NOPAT & ROIC

Looking at the company’s ten year financial track record, there is a clear delineation pre and post-2006, representing the shift in business strategy.

Even after adjusting for the payments due to NCI, the core business is solid, with sustainable ROIC in the mid-teens.

Looking at the past five years, the business becomes even more attractive on a cash ROIC basis, as D&A is higher than maintenance capex:

UMS - Owners Earnings FCF

And over that time, the company has provided a double-digit FCF yield, with a significant (and increasing) portion of that cash returned to shareholders:

UMS - FCF Yield

So why is the company trading at an EV/EBITDA < 3x? (Added: See comments below)

Lack of growth. (Added: And due to the fact that the majority of the EBITDA goes towards NCI)

The company has struggled to grow its business organically (or at least grow faster than the rate of inflation). 2011 sales of €38.3M were up only 11% from the 2004 number – that’s just 1.3% per year.

Due to a recent acquisition and stronger organic growth, 2012 sales should reach the €42-43M range, but this is definitely not a fast-growing business, so let’s value it as a ‘no-growth’ stock:

UMS - No Growth Valuation

Despite a share price that is up 33% in the past year, UMS is still trading at a 28% discount to its EPV valuation.

Not only does this provide a margin of safety, but any growth (if it ever materializes) is free.

Conclusion

UMS has carved out a niche for itself within this mobile medical services space.

If the recent run-up in share price is any indication, maybe some investors are starting to take notice of the new shareholder-friendly strategy, as the stock continues to offer a steady double-digit yield (not bad in today’s rate environment).

The company is not exciting, and many investors seem to pass over such steady cash flow generating stocks in a pursuit of growth. However, as evidenced by UMS’ past, growth – if done for growth’s sake – can destroy value.

Finally, I think it’s important to point out the mission of Capiton Value, which continues to hold a sizable stake in the business:

“[Capiton Value’s] objective is to purchase significant shares in noticeably undervalued medium-sized enterprises as well as offering when suitable the respective management support for the implementation of value-creating measures…CVM combines capital market know how of many years with sound private equity expertise

“CVM can offer support ranging from e.g. enhancement of capital market communication up to divestments (sometimes combined with a cash out) or Buy & Build strategies as far as assistance during a Going Private

It remains to be seen whether CVM’s involvement could be an eventual route towards closing this value gap for minority equity holders…

Disclosure

Long UMS