This is part two of my series on abnormal stock market anomalies. I originally wrote a post about the S&P 500 index effect.

The second part of the series will focus on deletions.

S&P Deletions

Each time a stock is added to an S&P index, a corresponding deletion occurs to keep constant the number of companies with the index.

S&P has the option of moving stocks down to a lower index such as the S&P MidCap 400 or S&P SmallCap 600, or deleting them from all indices.

Firms are deleted for a number of reasons: declining market cap, a merger with another company, or moving headquarters to a foreign country.

The key theory behind this strategy:

Index funds and other institutional investors must indiscriminately sell their holdings in stocks deleted from the index, without regard to current financials, future outlook, or intrinsic value.

Price Movements for Deletions

For deletions, the effect is the opposite of stocks added to the index. The price drops sharply after the Announcement Date (AD) until the Effective Date (ED) as institutional investors dump the stock.

Trading Strategy

In the book, the primary strategy for deletions is to purchase the stock after the effective date, with the goal of capturing a rebound in stock price caused by the indiscriminate selling during the announcement period.

For these results, stocks were purchased on the close of the effective date. Price targets were set at 1.5x the abnormal drop in price during the announcement period, with positions closed after 20 business days if the target exit price is unmet.

Recent Results

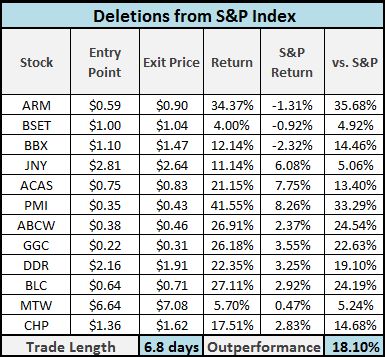
S&P Deletions - Original Trading Strategy

There were 12 events that met the criteria for this trading strategy. Only 1 stock, BSET, failed to reach its target price within the 20 day window.

Average outperformance was 18.10%, with stocks reaching their target exit price after only 6.8 days on average.

Results through ED +20

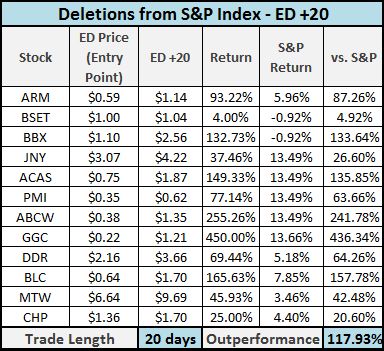
To further test the strategy, stocks were tracked for the full twenty day period after the effective date, with even better results:

S&P Deletions - Trading through ED +20

Conclusions

Logically, some stocks removed from the index are on the verge of bankruptcy, having suffered significant loss in market cap over the previous weeks or months.

In this limited sample, this was not the case, as all stocks recovered their initial drop in price, before continuing to appreciate rapidly.

Recent results seem to show a large, abnormal price increase after a stock is deleted from the S&P indices.

Discussion

Why such a large outperformance? Could these stocks be candidates for value investors, a la the mindset around stock spinoffs in Joel Greenblatt’s book?

What are your theories?

Disclosure

No position in any of these stock at the time of this writing.

Fidelity National Information Services, Inc (FIS) is a financial services company with over $3.7 billion in annual sales, focused on credit card and mortgage processing.

Background

On May 6, 2010, the Wall Street Journal reported that FIS was in talks with the Blackstone Group and THL Partners, two private equity firms, about a leveraged buyout in the $10-11 billion range.

The stock jumped on the announcement, and moved even higher after rumors surfaced that another private equity firm wanted in on the deal as well. News organizations increased their estimates to more than $15 billion, making it potentially the largest leveraged buyout since the start of the credit crisis.

However, on May 18, the deal fell through and the Company decided to pursue a leveraged recapitalization plan and substantial share repurchase instead.

Announcement

On May 25, the Company released a statement outlining the terms of the recapitalization plan:

As stated in the news release, our Board of Directors has authorized a plan under which our Company will repurchase up to $2.5 billion of its common stock at a price range of between $29.00 – $31.00 per share through a modified “Dutch auction” tender offer. In order to effect the proposed recapitalization, we intend to borrow approximately $2.5 billion of incremental debt. FIS is in a strong financial position and generates significant free cash flow, so we are very comfortable with the proposed debt levels that we will incur in repurchasing the company stock.

Odd-Lot Provision

Although the final price level and number of shares purchased will be determined by the dutch auction, the tender offer provides priority to ‘odd lot’ shareholders of less than 100 shares.

Even if the offering is oversubscribed, this provision ensures small shareholders will receive a full cash-out without any proration, a great opportunity for the average investor.

Timeline

May 25: FIS announces details about the proposed recapitalization plan and self-tender offer.

July 6:  The Company sells $1.1 billion in Notes to qualified institutional buyers, the main condition for the share repurchase

July 6: FIS commences the tender offer.

July 16: Proposed closing of $1.1 billion Note offering

August 3: Conclusion of the tender offer

Late August: Shareholders who validly tender their shares will be cashed out at the final auction price, with priority for the ‘odd lot’ shareholders defined above.

Return Scenarios

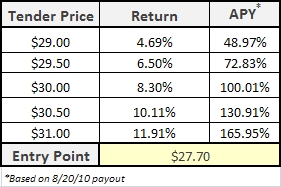
As of July 9, I’m adding FIS to my ValueUncovered portfolio using the latest closing price of $27.70.

FIS Tender Offer - Return Scenarios

Final Tender Price

TBD

Conclusion

The deal offers attractive annualized returns for a month long trade.  Although there is always risks with such a large transaction, FIS is very well capitalized and I don’t forsee any problems with the offer going through.

I think Frank Martire, the Company’s President & CEO, says it best:

The recapitalization plan is consistent with our commitment to doing what is in the best interests of our company, our clients and our shareholders. Our strong financial position, combined with appropriate market conditions and our excellent relationships with lenders, make this the right move at the right time.

Supporting Documents

[table id=6 /]

Disclosure

Long FIS

I recently finished the excellent book, “Beyond the Random Walk: A Guide to Stock Market Anomalies and Low-Risk Investing” by Vijay Singal. The book details 10 pricing anomalies in the financial markets that have proven to generate abnormal (market-beating) returns.

I’ve always been very interested in the published academic papers that detail financial trading strategies, but often find myself getting bogged down in the dry ‘academic-speak’ and equations when I try to decipher them.

Singal does a great job of synthesizing these academic studies into real, actionable investment strategies.

Index Effect

One idea that caught my eye was the S&P 500 Index Effect.

Like many investors, I compare my financial returns to the S&P 500, a group of 500 leading companies in leading industries pulled from the U.S. stock market – many consider it to be the best proxy for the total market.

The individual stocks within the S&P 500 change throughout the year – corporate restructurings, market cap fluctuations, and M&A activity all affect the latest group of stocks in the index.

Standard & Poors usually announces the change five days before the stock is officially added to the index.

Historic Returns

For a variety of reasons – such as index funds needing to buy or sell to match the S&P – individual stocks added to the S&P 500 list have experienced an immediate price jump after the announcement, with additional gains to follow until the stock officially joins the index.

According to a study of 224 additions to the S&P 500 from 1989-2000, the abnormal return for this trading strategy was 3.1%.

With an average trade length of only 6 days, this trading strategy seems to offer very exciting annualized returns, so I decided to test the recent results.

Analysis

For this ‘S&P 500 Additions’ strategy, I went back and recorded every valid addition & deletion to the S&P 500 from 2009 to the present. I gathered the results separately for two types of events:

  • Brand new additions
  • Additions from another S&P index (i.e. S&P MidCap 400 or S&P SmallCap 600)

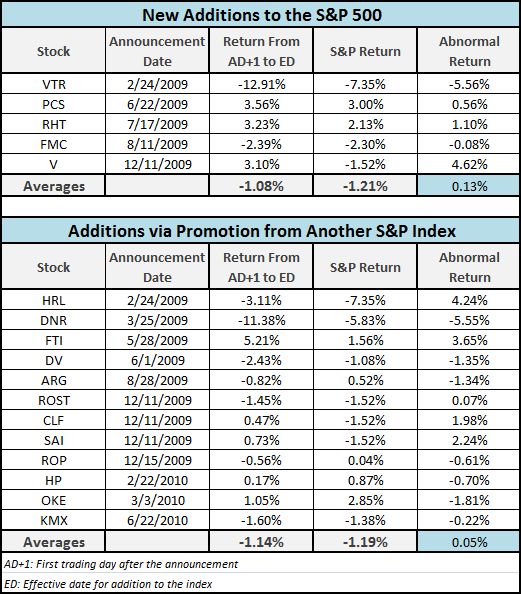
The results below:

S&P 500 Additions Strategy - Abnormal Returns

It is a very small sample size, but the results are a bit disappointing.

Conclusions

New additions to the S&P 500 gained 0.13% vs. the market, while stocks that entered the S&P 500 by moving up from another S&P index list gained 0.05% relative to the market.

Has anyone traded on this strategy before? What was your experience?

Do you think the index effect will continue?

Part 2 – S&P Deletions: Unwanted Stocks Lead to Market Beating Returns